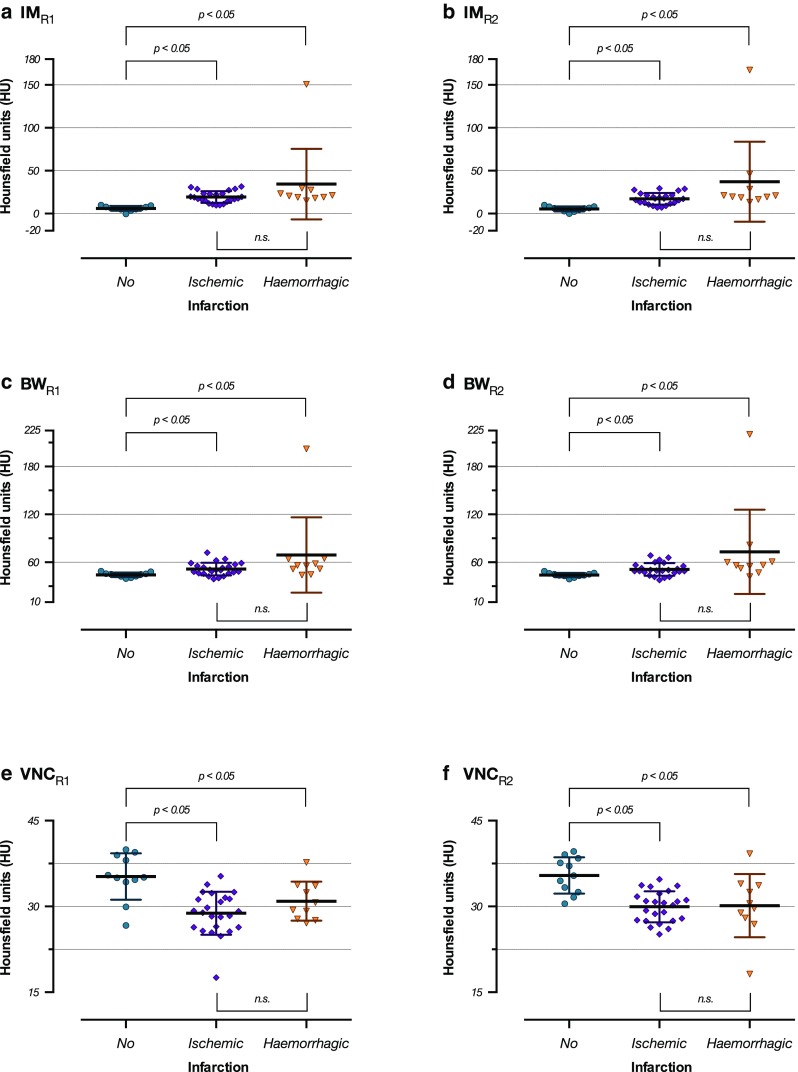
Fig. 3.

a–f Scattergrams of the density means ± standard deviations in the groups “no infarction”, “ischemic infarction”, and “haemorrhagic” infarction on the iodine map series for reader 1 (Figure 3a) and reader 2 (Figure 3b), brain window series for reader 1 (Figure 3c) and reader 2 (Figure 3d), and the virtual non-contrast series for reader 1 (Figure 3e) and reader 2 (Figure 3f). There are significant differences between the groups “no infarction” and “ischemic infarction” and “no infarction” and “haemorrhagic infarction”, but not between “ischemic infarction” and “haemorrhagic infarction” (Kruskal-Wallis tests with Dunn’s post hoc tests)
