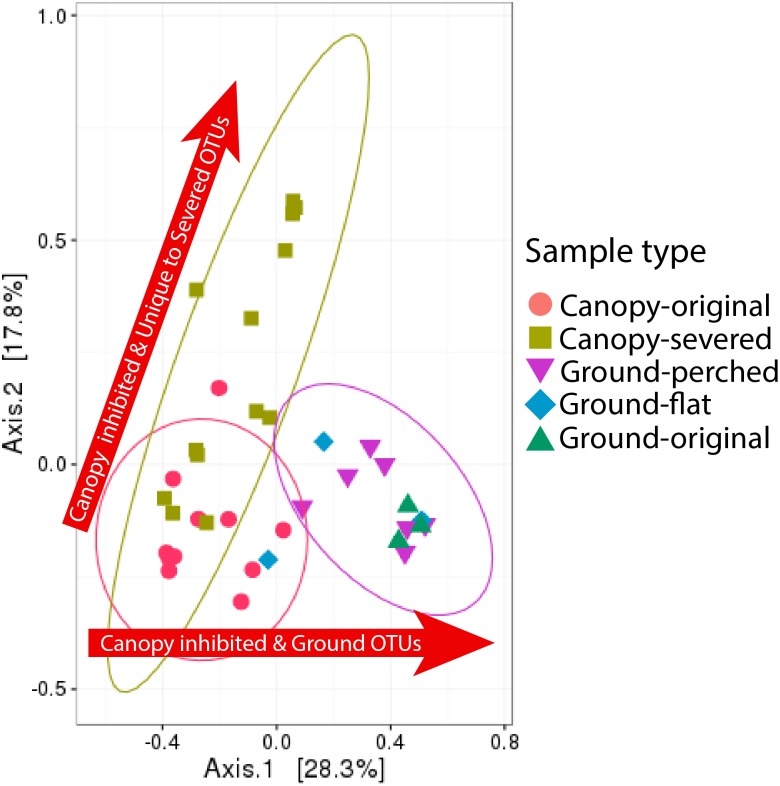
Figure 3. Shifts in bacterial community composition associated with canopy-severed compared to ground-perched and ground-flat treatments with canopy-original and ground-original representing the original community compositions.
The ellipses indicate where 95% of samples within a treatment are expected to occur on the plot. Ellipses could only be drawn for sample types containing at least five samples. Arrows reflect the interpretations of which taxa are affected by each treatment, as described in the text.

