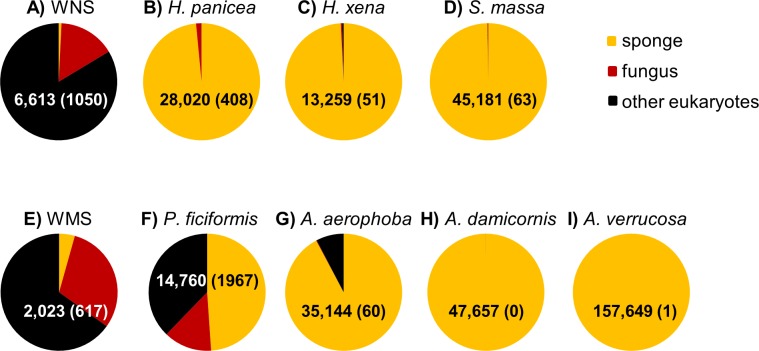
Figure 1. Relative abundance of sponge, fungal and “other eukaryotic” 18S rRNA gene sequences for sample types from the North Sea (A–D) and Mediterranean Sea (E–I).
The triplicate samples per sponge species are pooled and the numbers within the pie diagrams represent the number of sequences obtained for the sample type. The numbers in parentheses indicate the number of fungal reads obtained for each sample type. WNS, North Sea water; WMS, Mediterranean seawater.

