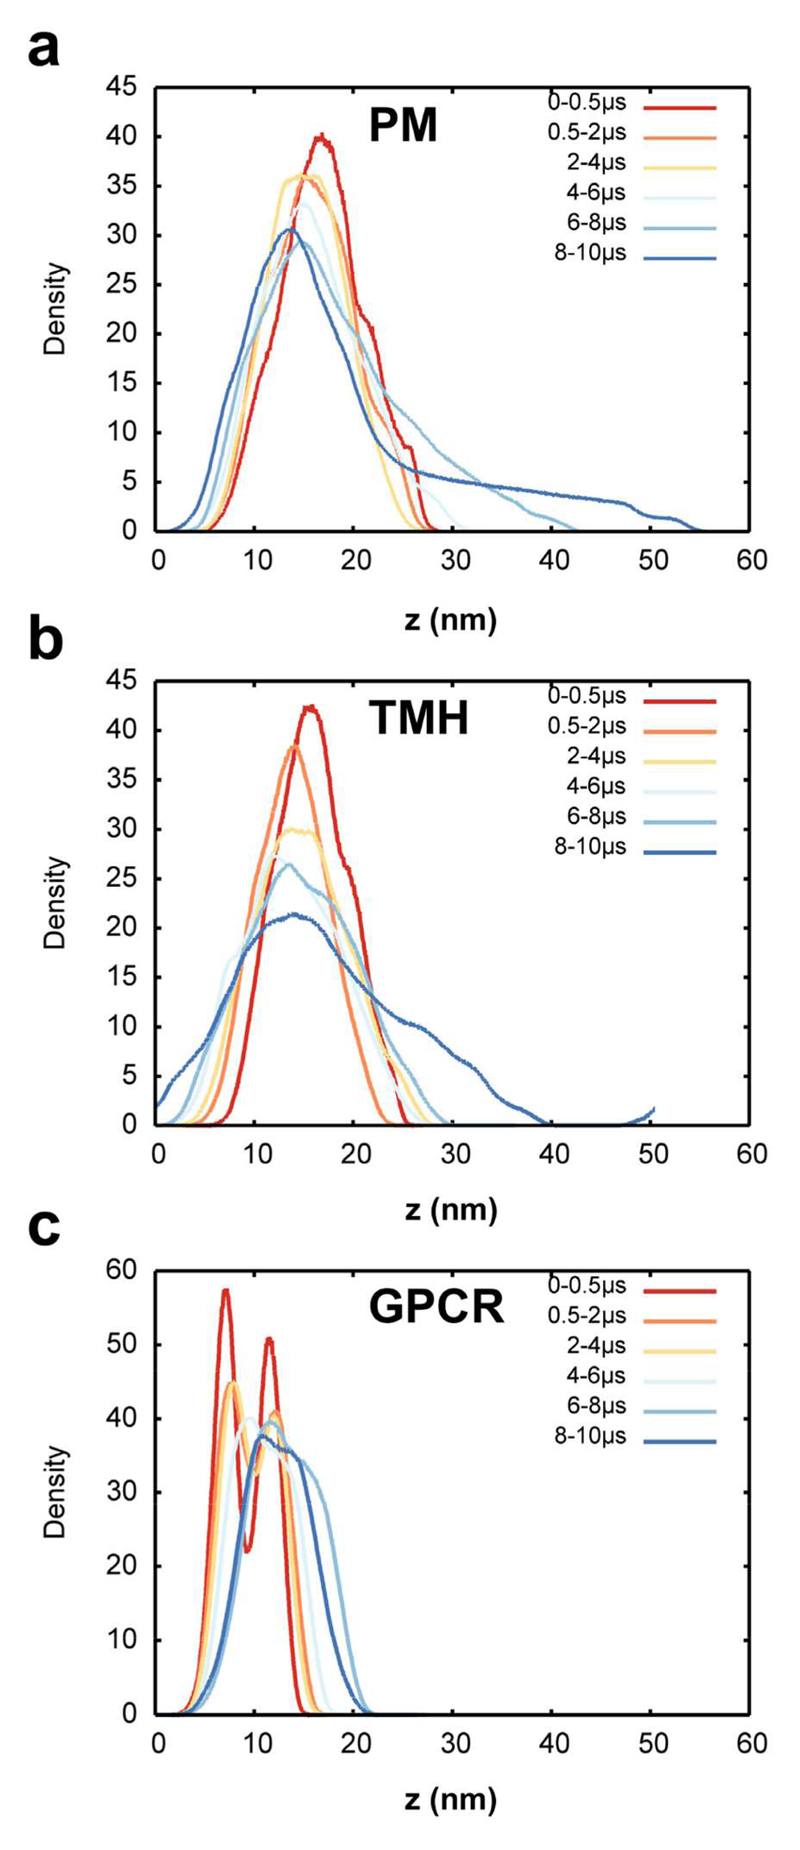
Figure 3. Lipid head group density distributions.
(a) Density of the head groups of all lipids except cholesterol at various intervals from the PM simulation. (b) Density of the head groups of all lipids except cholesterol at various intervals from the TMH simulation. (c) Density of the head groups of all lipids except cholesterol at various from of the GPCR simulation.

