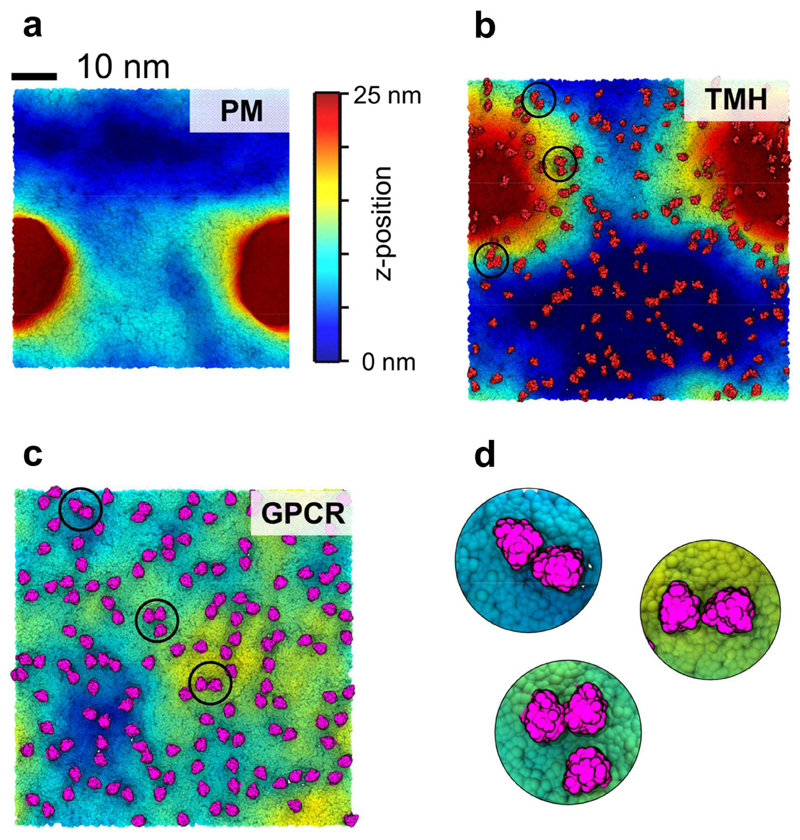
Figure 4. Membrane curvature and deformations.
Membrane curvature of the three simulation systems at 10 μs. The colour scale corresponds to the lipid headgroup z-position using a 0 (blue) to 25 nm (red) scale. (a) PM system without any proteins. (b) TMH system with the proteins shown in red. (c) GPCR system with the proteins shown in pink. (d) Zoom in on selected S1P1 oligomers within the GPCR system shown in (c).

