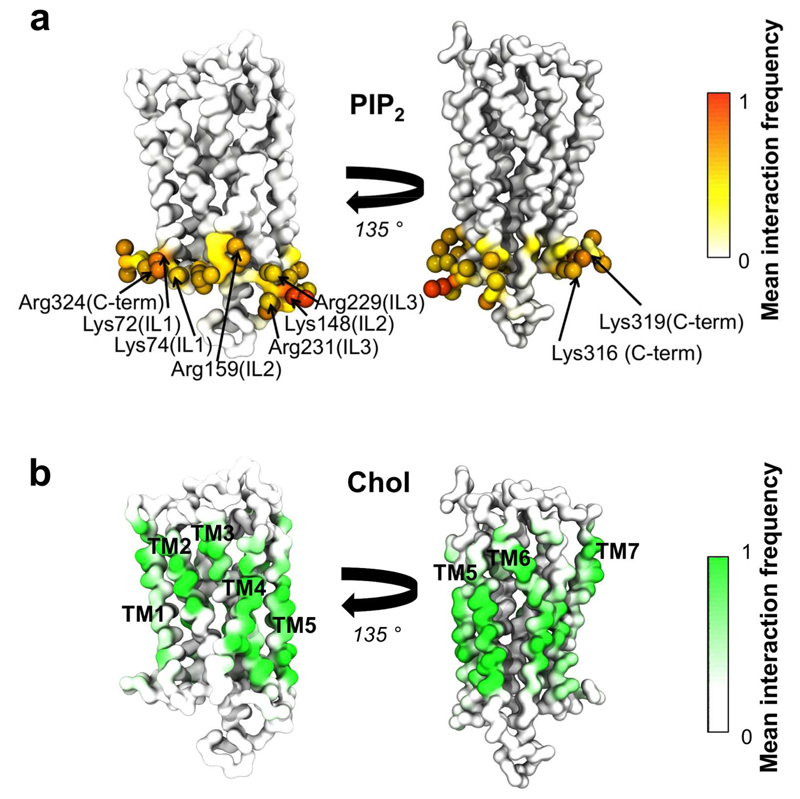
Figure 7. Protein-lipid interactions in the GPCR receptor system.
Interactions between PIP2 and cholesterol have been mapped onto the structure of one of the S1P1 receptors. The colour scale illustrates the mean fraction of time there is an interactions with all 144 repeats of the S1P1 receptor. Thus, a value of 1 indicates a lipid forms a contact with a given residue in all proteins over the entire duration of the simulation. (a) Interactions between the phosphoryl head group of PIP2 and the S1P1 receptor. Residues having interactions more than 75% of the time are shown as spheres. The basic residues within the residues have been labelled. (b) Interactions between any part of the cholesterol molecule and the S1P1 receptor.

