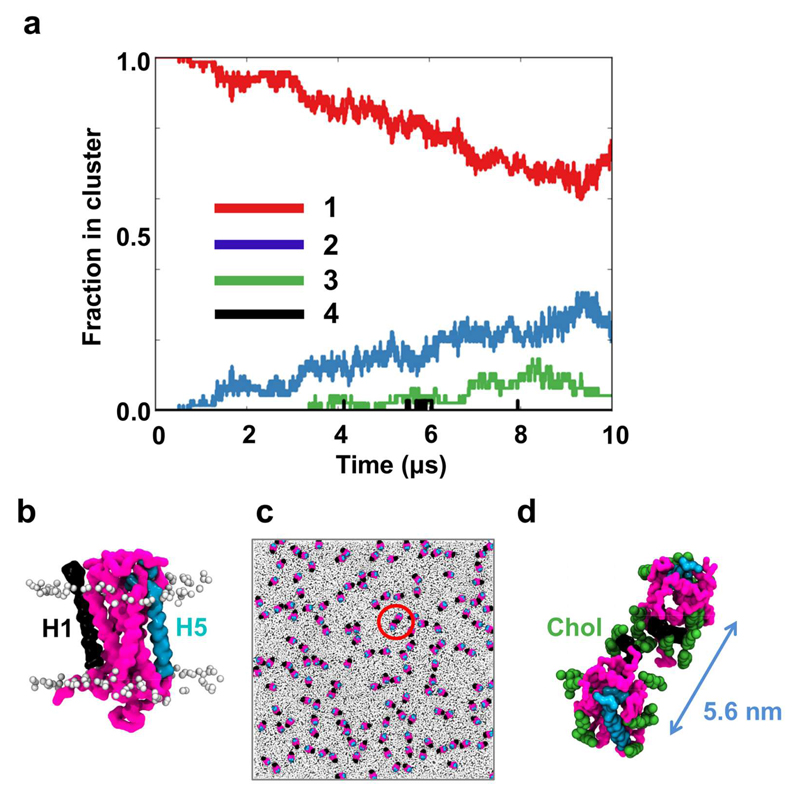
Figure 8. GPCR oligomerization.
(a) The clustering of S1P1 receptors within the GPCR system over time. Clustering was calculated using a cut-off distance of 6.0 nm between the centres of mass of adjacent proteins. (b) a S1P1 receptor (pink) with transmembrane helix 1 (H1; in black) and transmembrane helix 5 (H5; in cyan). (c) Orientation of the 144 GPCRs after 10 μs of simulation with the proteins colored as in (b) while all lipids are colored in light gray (d) zoom in on one of the GPCR oligomers. Cholesterol molecules within 5 Å of the proteins are shown in green and the distance between the centres of mass of the two proteins is shown in blue.

