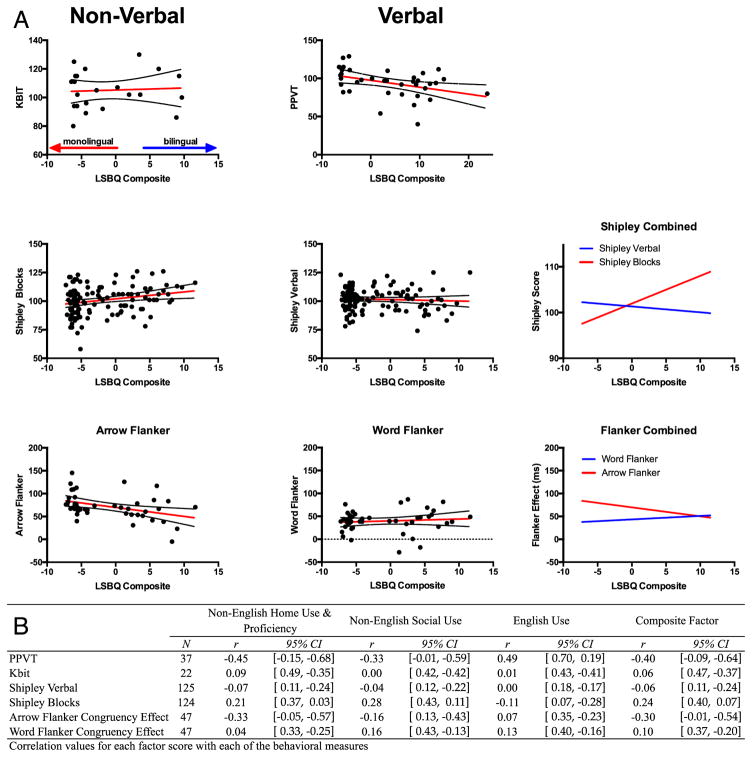
Figure 3.
Correlations of composite factor score with behavioral measures. Part A displays the relationship between the composite factor score and each of the behavioral measures. Dashed lines are upper and lower 95% confidence bounds. The sub-plots on the right side emphasize the interactions between the Shipley and Flanker word/non-word performance. Part B displays the correlation values and 95% confidence intervals for each factor.

