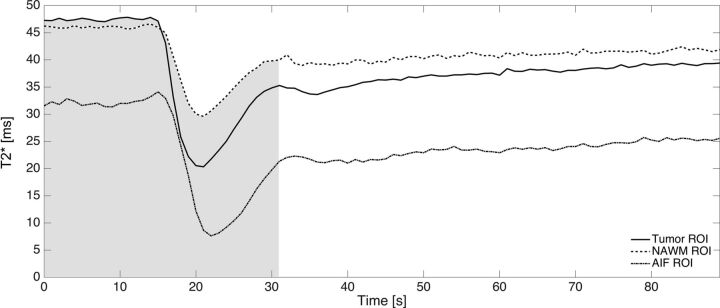
Fig 1.
An example from 1 patient of the absolute T2* time curves for tumor (solid), NAWM (dash dash), and the AIF (dash dot) ROIs. As described in Equation 6, the optimal TE is proportional to the weighted average of absolute T2* values during the first pass (as indicated by the shaded gray area) of the contrast agent.

