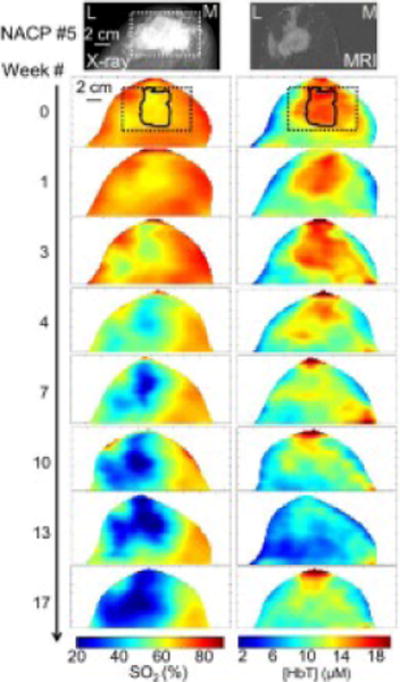
Figure 2.

Left breast images for NACP #5, an R (pCR) patient. In all images, the left side of each image is lateral (L) and the right side of each image is medial (M). The craniocaudal full-field digital mammogram (top left) depicts an irregular, partially spiculated mass (white box) located in the left breast corresponding to the patient’s biopsy-proven malignancy, prior to treatment. The MRI axial contrast-enhanced subtraction image (top right) demonstrates a 4.4 cm irregular mass with additional areas of non-mass enhancement extending to the nipple and laterally. The optical [HbT] and SO2 maps obtained throughout NAC show the progressive decrease of [HbT] and SO2 at the cancerous region (identified at week 0 by the solid line within the dashed rectangle corresponding to the location of the mass visible in the X-ray image). Subsequent surgical specimen (not shown) revealed a pCR.
