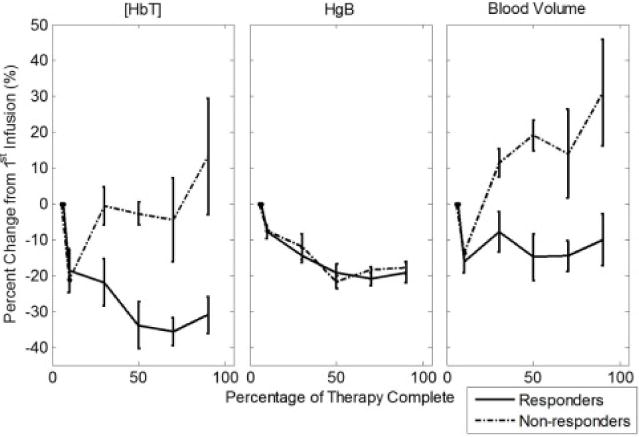
Figure 4.

Average change in blood volume, [HbT], and hemoglobin concentration in blood (Hgb) relative to the first infusion throughout chemotherapy for responders and non-responders. All patients show a similar systemic decrease in Hgb during NAC, but blood volume fraction in breast tissue decreases in responders and increases in non-responders.
