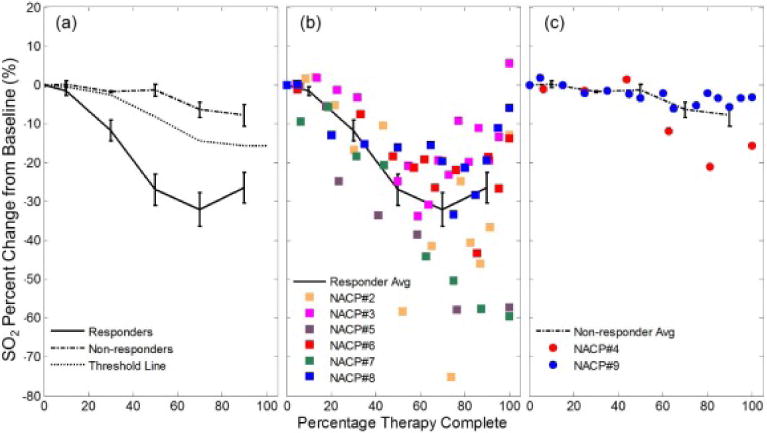
Figure 5.

(a) Trends of SO2 at the tumor ROI for both response categories at a group level (the error bars represent the standard error). The threshold dashed line represents the weighted average of the mean percent changes of SO2 for the R and NR groups using the inverse of the standard error as the weights. This line is used for assessing patient response and is discussed in relation to the cumulative response index. The individual patient data throughout therapy are shown in (b) for responders and (c) for non-responders, along with the corresponding group average line.
