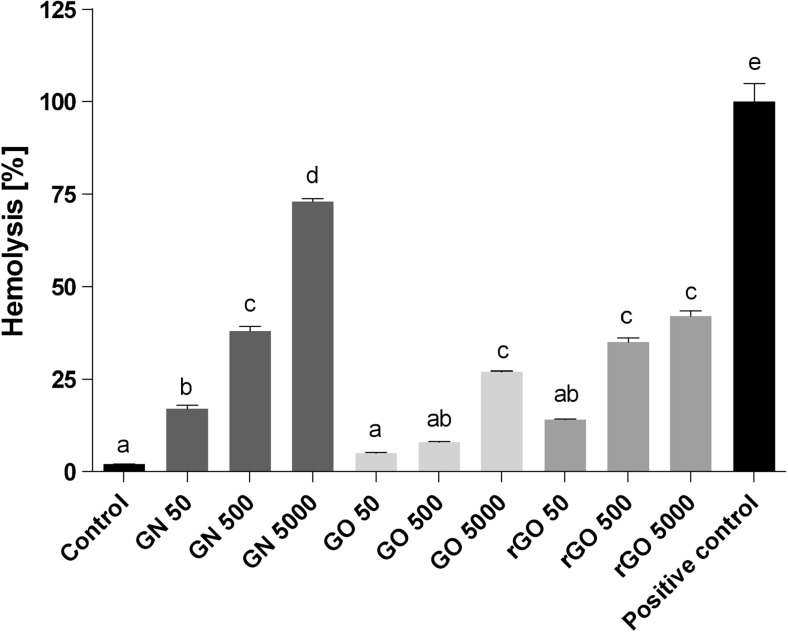
Fig. 6.
Level of hemolysis of red blood cells. Error bars indicate standard error of the mean. Bars with different superscripts denote statistically significant differences between the control group (non-treated) and groups treated with the following: pristine graphene, oxidized graphene, reduced oxidized graphene, and 3% hydrogen peroxide-positive control (P < 0.05). There were significant differences (P < 0.05) between different concentrations of graphenes

