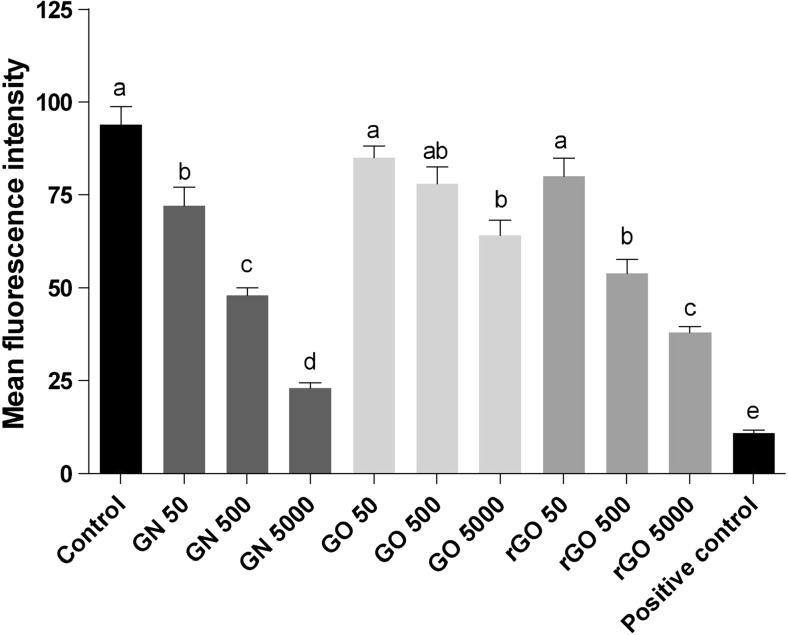
Fig. 7.
Effect of pristine graphene (GN), oxidized graphene (GO), and reduced oxidized graphene (rGO) on the ROS production of red blood cells. Bars with different superscripts denote statistically significant differences between the control group (non-treated) and groups treated with the following: GN, GO, rGO, and 3% hydrogen peroxide-positive control (P < 0.05). There were significant differences (P < 0.05) between different concentrations of graphenes

