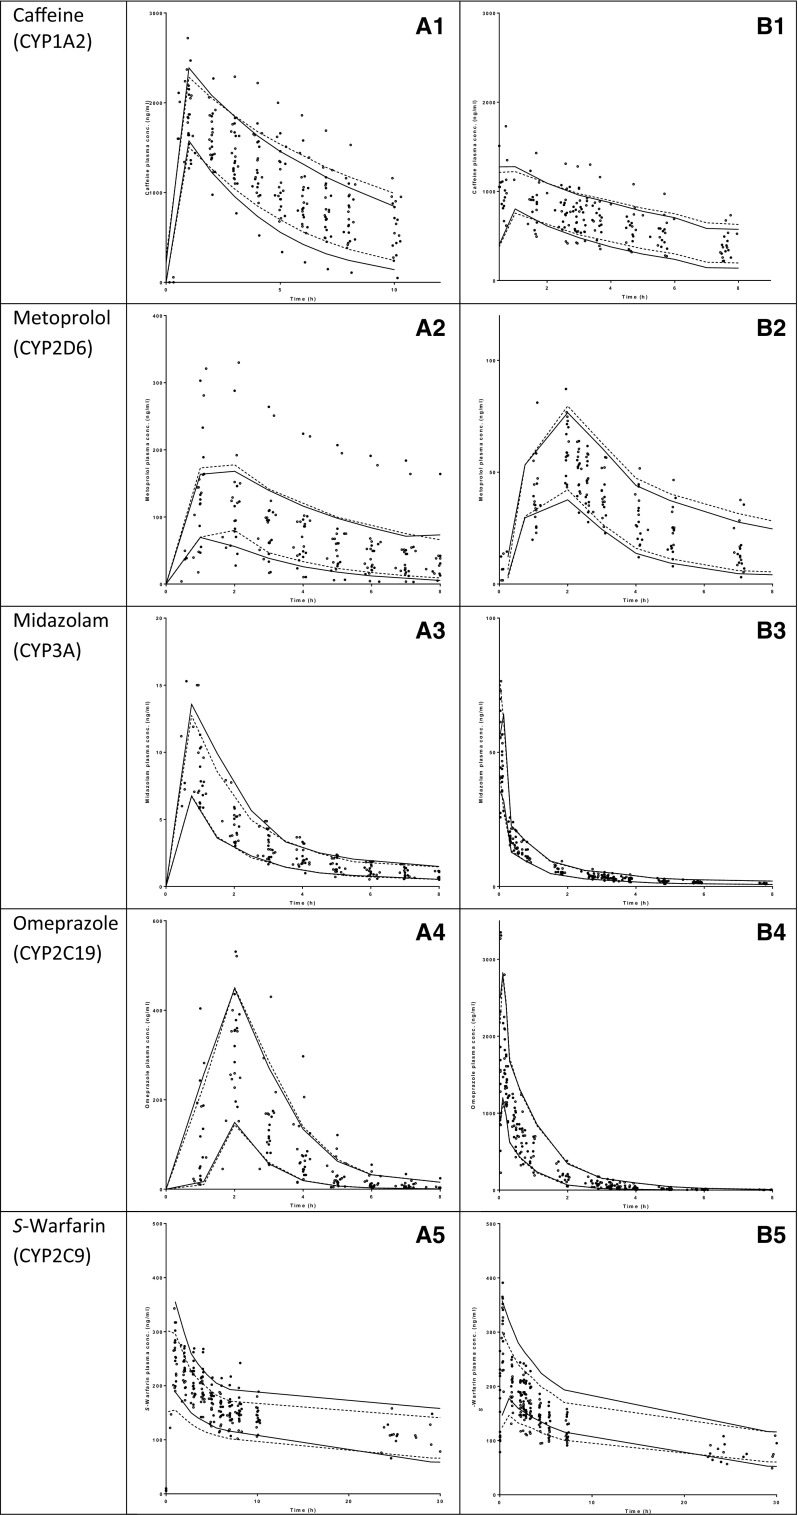
Fig. 2.
Visual predictive check plots of the five CYP probe drugs after oral [left panel (1)] and intravenous [right panel (2)] administration: a caffeine (CYP1A2); b metoprolol (CYP2D6); c midazolam (CYP3A4); d omeprazole (CYP2C19); e S-warfarin (CYP2C9). The closed circles represent the observed data points after 36 h of fasting and the open circles represent the control observations. The solid (36 h fasting) and dashed (control) lines represent the 10th and 90th percentiles of the simulated data. CYP cytochrome P450, conc concentration

