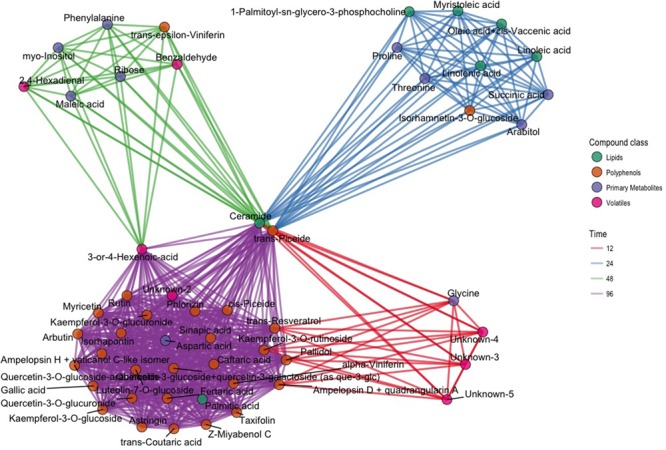
FIGURE 3.

Network plot representing the 64 most different metabolites in inoculated and not inoculated samples, corresponding to compounds having an absolute value of the t-statistic greater than 3 (|t| > 3). Each of the 64 compounds is represented with a dot; dots belonging to different classes are in different colors (green: lipids; brown: polyphenols; violet: primary compounds; pink: volatile compounds). Metabolites with differences after infection modulated at the same time point are linked using the color link of the specific time point (red: 12 hpi; blue: 24 hpi; green: 48 hpi; violet: 96 hpi).
