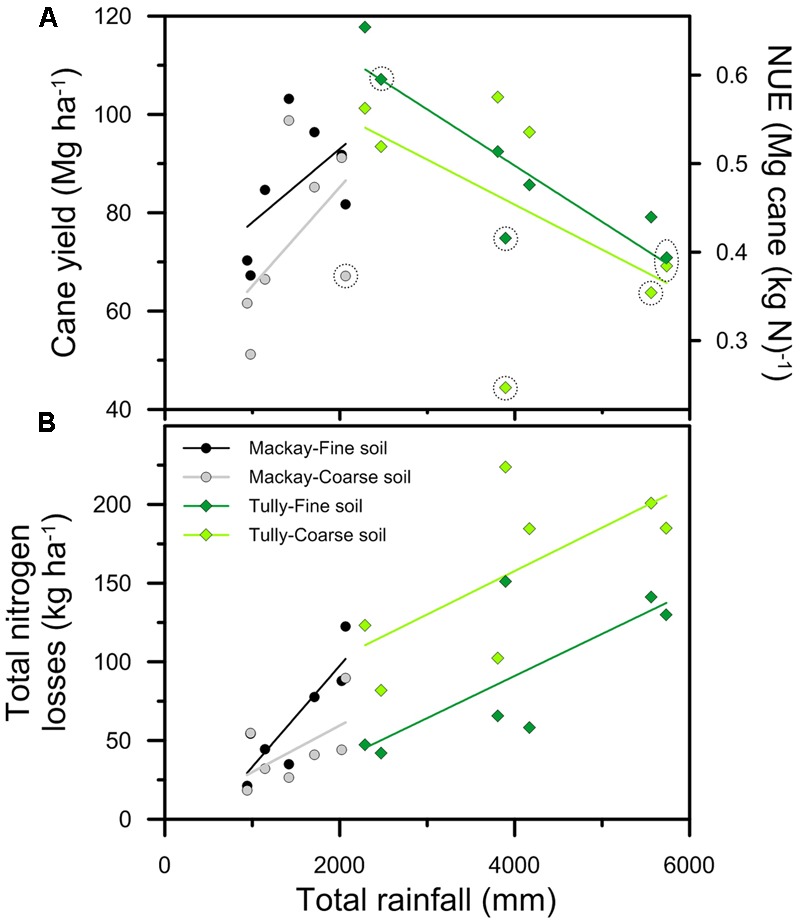
FIGURE 5.

The relationship between total rainfall falling during each crop and (A) cane yield and nitrogen use efficiency (NUE), and (B) total nitrogen losses for crops simulated in Figure 4 with 180 kg ha-1 of N fertilizer applied. The lines indicate the trends in yield and total nitrogen losses in response to rainfall at Mackay (gray and black) and Tully (light and dark green). The points circled indicate crops where yields simulated with 210 kg ha-1 of N fertilizer were more than 2% greater than yields at lower nitrogen rates. [NB: In (A), NUE is derived from cane yield divided by 180 kg ha-1 of N.]
