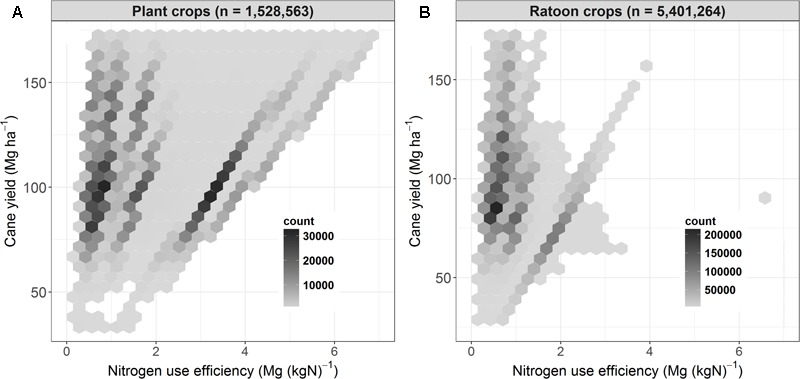
FIGURE 7.

Yield as a function of nitrogen use efficiency (yield produced/fertilizer N applied) for sugarcane plant (A) and ratoon (B) crops simulated across regions, soil types, and management practices over 84 years (1928–2011). Hexagons contain all the data points located in that region of the figure. The number of points plotted within each hexagon is indicated by the shade of gray of the hexagon (darker shades represent a higher number of points).
