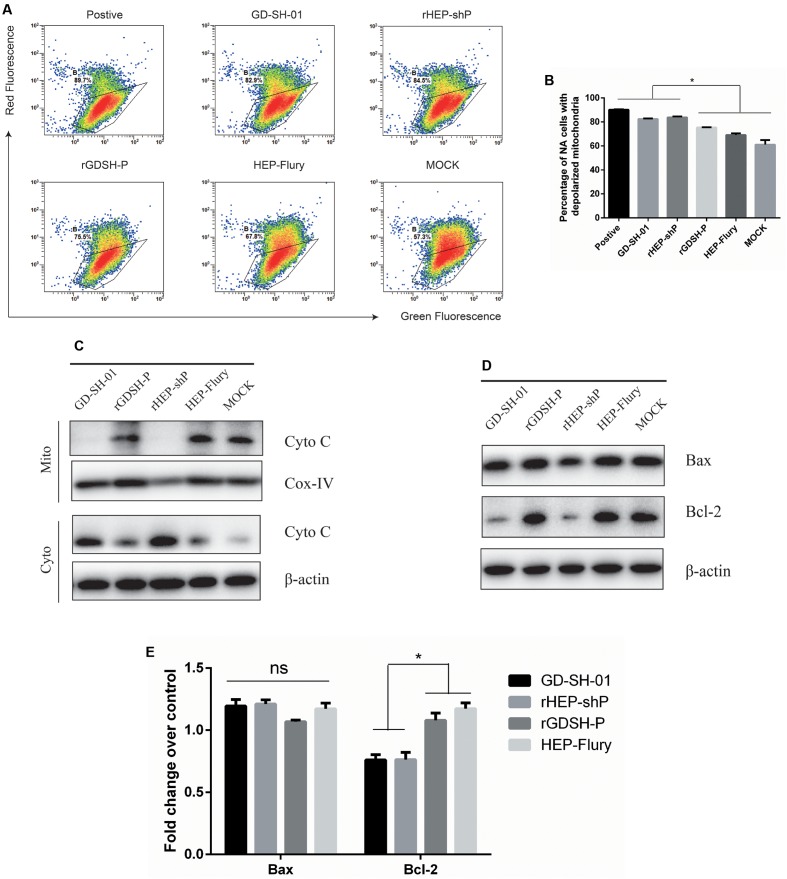
FIGURE 4.
Analysis of activation of the intrinsic apoptotic pathway. NA cells were infected with GD-SH-01, HEP-Flury, rHEP-shP, or rGDSH-P. (A) Analysis of ΔΨm with FCM using JC-1 dye. A representative density plot is shown for each condition. Expression of ΔΨm expressed as the JC-1 monomer-to-polymer fluorescence ratio. (B) Analysis of the ΔΨm using chart plots. Protein contents of cytosolic and mitochondrial cytochrome c (C), and bax and bcl-2 (D) were assessed by WB. COX-IV and β-actin were used as loading controls. (D) Relative expression of bax and bcl-2 as measured by means of RT-qPCR. Data are represented as means ± SD of three independent experiments. One-way ANOVA followed by Bonferroni’s multiple comparison test. ∗p < 0.05, ns, not significant.

