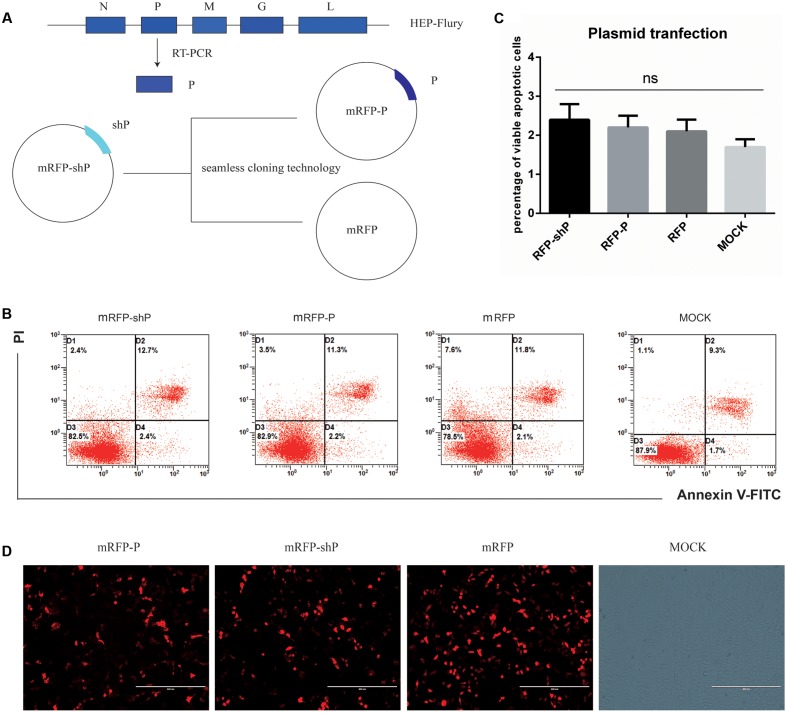
FIGURE 5.
P of GD-SH-01 alone cannot induce detectable apoptosis. (A) Graphic illustration of constructed plasmids of mRFP-P, and control plasmid mRFP via seamless cloning technology on the background of mRFP-shP which was previously constructed. (B) NA cells were transfected with mRFP-shP, mRFP-P, and mRFP, respectively, and transfection without plasmid was used as a control. Apoptosis rates were determined 2 days post transfection by means of FCM. (C) The results in bar chart come from three scatter diagrams of each group. Data are represented as means ± SD of three independent experiments. One-way ANOVA followed by Bonferroni’s multiple comparison test. ∗p < 0.05, ns, not significant. (D) The efficacy of the transfection and expression levels of P was examined under a fluorescence microscope at 2 days post-transfection (representative images were presented here).

