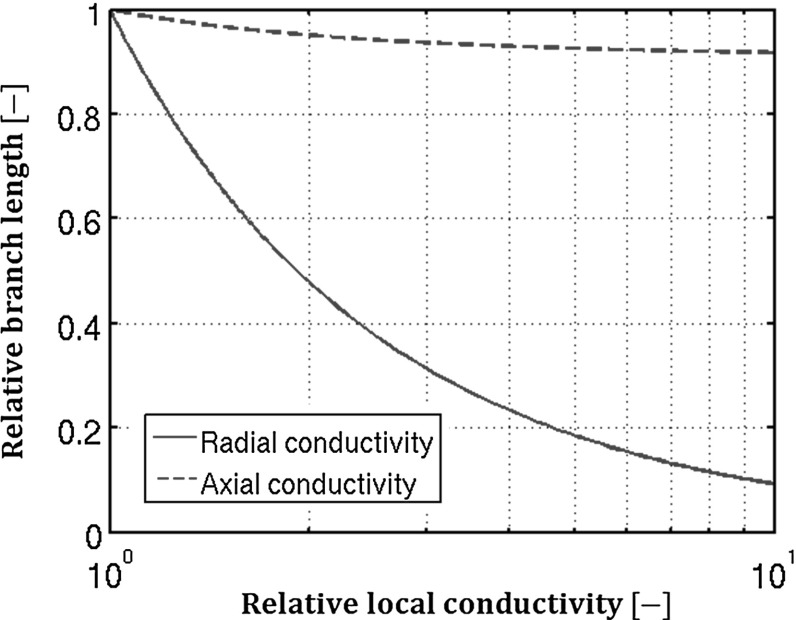
Fig. 10.
Quantitative phenotyping illustration: ratio of new to old root branch length needed to reach half the original asymptotic conductance when increasing the radial conductivity by a factor a (solid line) or the axial conductivity when increasing the axial conductivity by a factor b (dashed line). The horizontal axis represents the factor a or b

