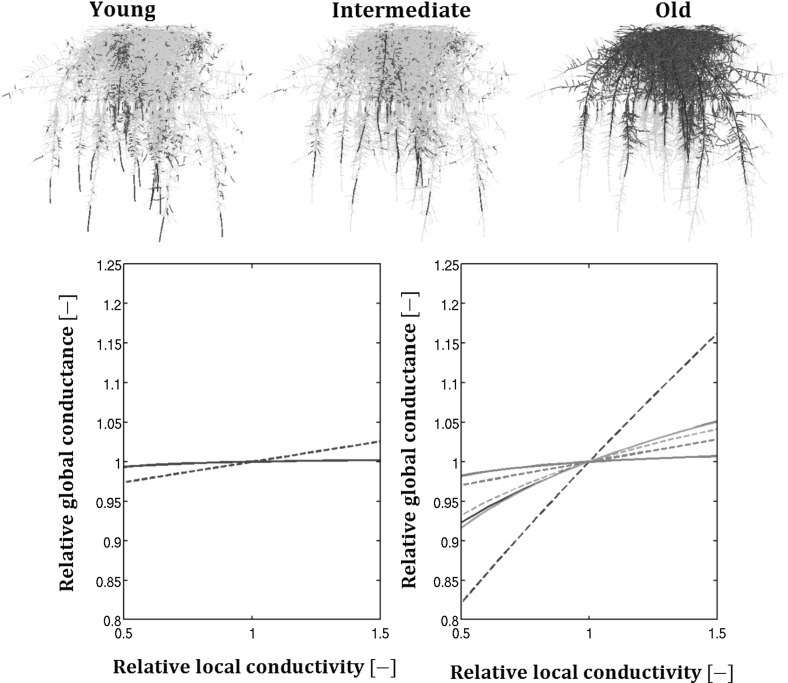
Fig. 9.
Sensitivity analysis of a maize root system: the top panels represent a maize root system architecture highlighting the different root zones: young (left), intermediate (center) and old (right) root zones for both primaries (blue) and lateral (red) roots. Bottom subplots show the effect of modifying local radial (dashed) or axial (solid) conductivities of the primary (left) or lateral (right) roots on the RS conductance in a one-by-one sensitivity analysis. The curves are coloured as a function of the segment ages and consequently their hydraulic conductivities: the darker, the younger

