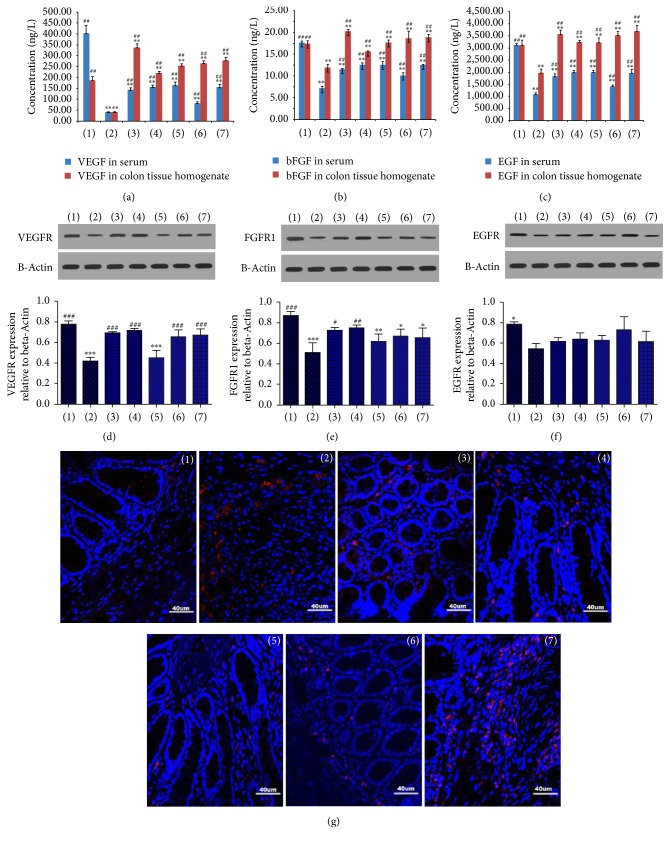
Figure 4.
Effects of Garidisan on functional maturity of regenerated mucosa. (a) The concentration of VEGF in serum and colon tissue homogenate; (b) The concentration of bFGF in serum and colon tissue homogenate; (c) The concentration of EGF in serum and colon tissue homogenate; (d) VEGFR expression in colons of experimental animals and statistical analysis; (e) FGFR1 expression in colons of experimental animals and statistical analysis; (f) EGFR expression in colons of experimental animals and statistical analysis; (g) CD105 expression in colons of experimental animals. Blue DAPI staining represents nuclear staining, and red represents CD105 expression in cy3 staining. Note that (1) represents normal controls; (2) represents the UC model group; (3) represents the low-dose Garidisan group; (4) represents the moderate-dose Garidisan group; (5) represents the high-dose Garidisan group; (6) represents the SASP group; and (7) represents the Bupiyichangwan group; ∗P < 0.05, ∗∗ P < 0.01, and ∗∗∗P < 0.001 compared with normal controls; #P < 0.05, ##P < 0.01, and ###P < 0.001 compared with the UC model group.

