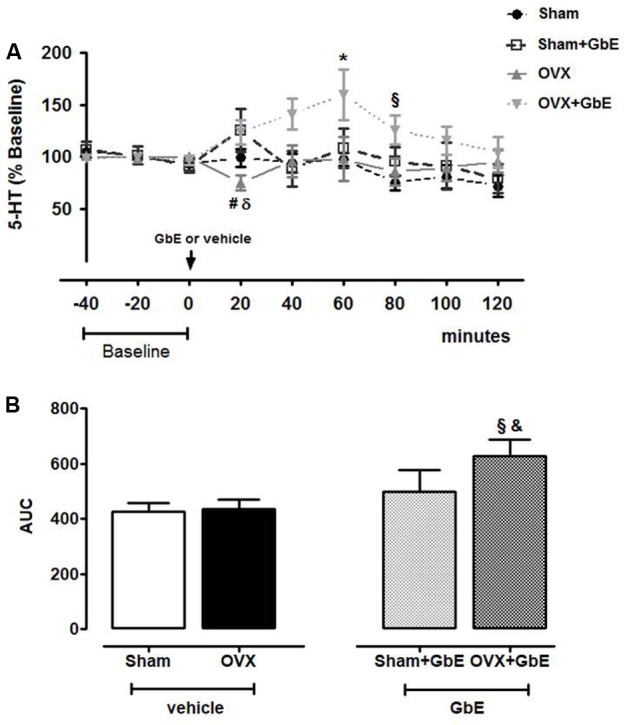
FIGURE 5.

Medial hypothalamic serotonin extracellular levels as measured by in vivo microdialysis. (A) 5-HT levels (% baseline) in 20-min VMH microdialysate samples collected before (baseline –40 to 0 min) and up to 120 min after gavage with either vehicle or 500 mg.kg-1 of GbE and (B) area under the curve (AUC) of 5-HT extracellular levels during the 120 min of microdialysate collection after gavage of Sham (n = 6–7), Sham + GbE (n = 5–6), OVX (n = 5–10), and OVX + GbE (n = 7–10). ∗p ≤ 0.05 vs. baseline; x p ≤ 0.05 vs. Sham; #p ≤ 0.05 vs. Sham + GbE; &p < 0.05 vs. OVX; δp ≤ 0.05 vs. OVX + GbE.
