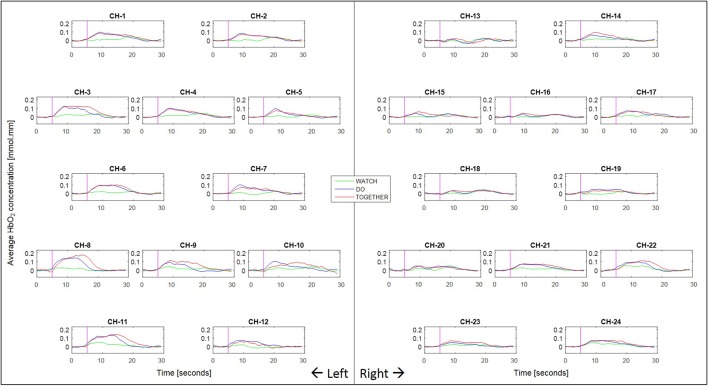
Figure 4.
Second to second blocked HbO2 data per condition and channel. Pink vertical line denotes the start of the stimulation period and the following 240 frames across the stimulation (11–13 s) and post-baseline (13–11 s) period. The sampling frequency of the fNIRS system was 10 Hz (i.e., 10 data frames per second were collected).

