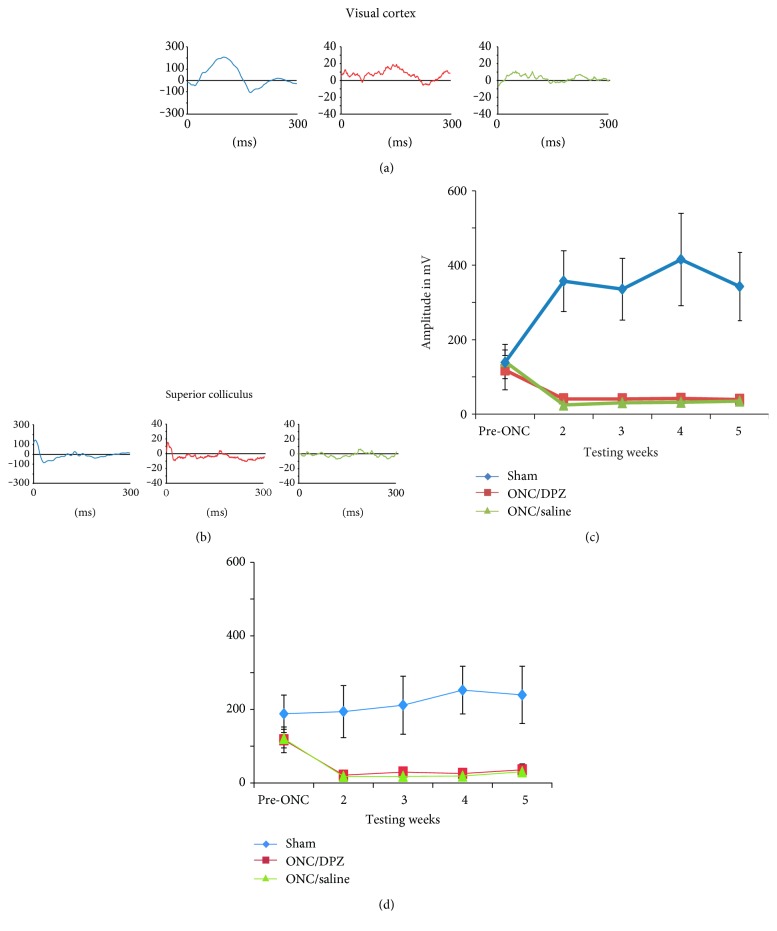
Figure 3.
Visual evoked potentials recording in the primary visual cortex and the superior colliculus before and after the partial optic nerve crush. Amplitude of the VEP recorded before and once a week for four weeks after the ONC in the visual cortex (a), (c) and in the superior colliculus (b), (d) for the 3 groups: sham (blue), ONC/DPZ (red), and ONC/saline (green). (a), (b) VEP tracing examples recorded at week 5 in the visual cortex (a) and the superior colliculus (b). VEP amplitudes show a substantial drop in both ONC groups after the crush and a significant reduction of the VEP amplitude compared to sham groups both in the visual cortex (c) and in the superior colliculus (d). This indicates that cortical and subcortical visually evoked activity was not restored after the crush for any treated groups.

