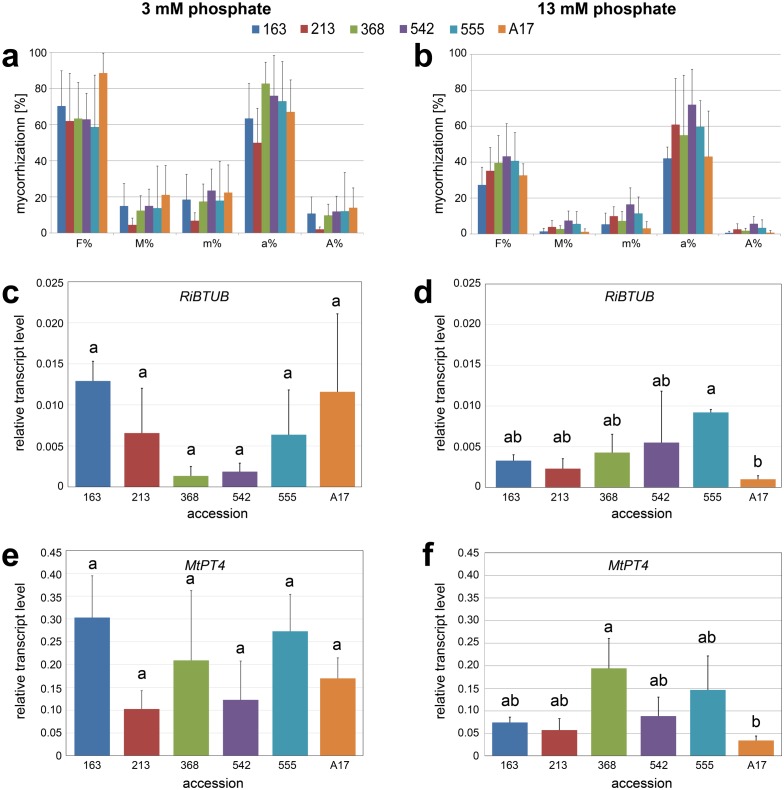
Figure 3. Mycorrhization of selected accessions.
Accessions No. 163, 213, 368, 542, 555 and reference line A17 were grown in expanded clay, inoculated with R. irregularis for two weeks and fertilized either with reduced phosphate levels (20% corresponding to 3 mM Pi, A, C, E) or fully supplied with phosphate (100% corresponding to 13 mM Pi, B, D, F). (A, B) Mycorrhization rate quantified using the method described by Trouvelot, Kough & Gianinazzi-Pearson (1986). F%, frequency of mycorrhiza in the root system; M%, intensity of the mycorrhizal colonization in the root system; m%, intensity of the mycorrhizal colonisation in the root fragments; a%, arbuscule abundance in mycorrhizal parts of root fragments; A%, arbuscule abundance in the root system. Data are presented as means + SD (n = 5). There were no significant differences between the ecotypes within each parameter analyzed (tested using one-way-ANOVA with Tukey’s HSD test). (C, D) Mycorrhization determined by transcript level of RiBTUB in relation to MtHIS3L. Data are presented as means ± SD (n = 3). Different letters indicate significant differences (one-way-ANOVA with Tukey’s HSD test, p < 0.05). (E, F) Functional arbuscules determined by transcript level of MtPT4 in relation to MtHIS3L. Data are presented as means ± SD (n = 3). Different letters indicate significant differences (one-way-ANOVA with Tukey’s HSD test, p < 0.05).

