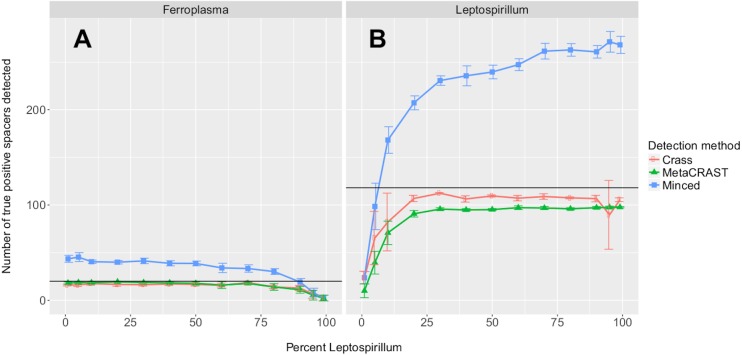
Figure 4. Evaluation of MetaCRAST, Crass, and MinCED performance on simulated metagenomes with varying proportions of Ferroplasma acidarmanus fer1 and Leptospirillum sp. Group II ‘CF-1’ genome sequences.
Simulated metagenomes were generated with Grinder. The data points shown represent the average number of “true positive” spacers detected that matched spacers in corresponding Ferroplasma or Leptospirillum CRISPR arrays (A and B, respectively). All data points represent the averages of six individual simulations and are presented with error bars representing two times the standard error above and two below the average. The true number of spacers expected for each genome is marked with a black line (20 expected in the Ferroplasma genome; 118 in the Leptospirillum genome).

