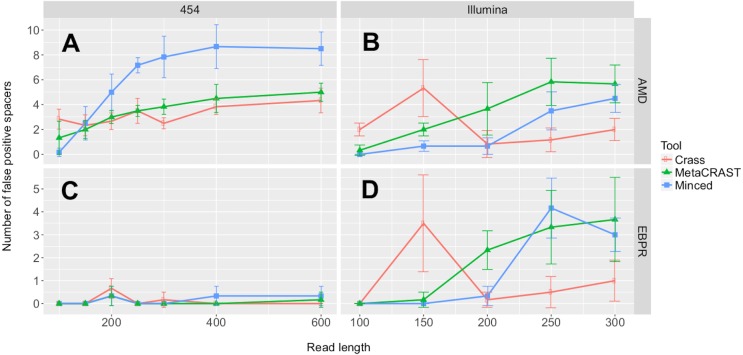
Figure 6. Evaluation of MetaCRAST, Crass, and MinCED false positive detection on simulated AMD (A and B) and EBPR (C and D) metagenomes.
The procedure for generating the simulated metagenomes is described in Materials and Methods. The number of detected spacers matching expected ones was subtracted from the total number of spacers detected to determine the number of false positive spacers for a particular method and condition. All data points represent the averages of three individual simulations and are presented with error bars representing two times the standard error above and two below the average.

