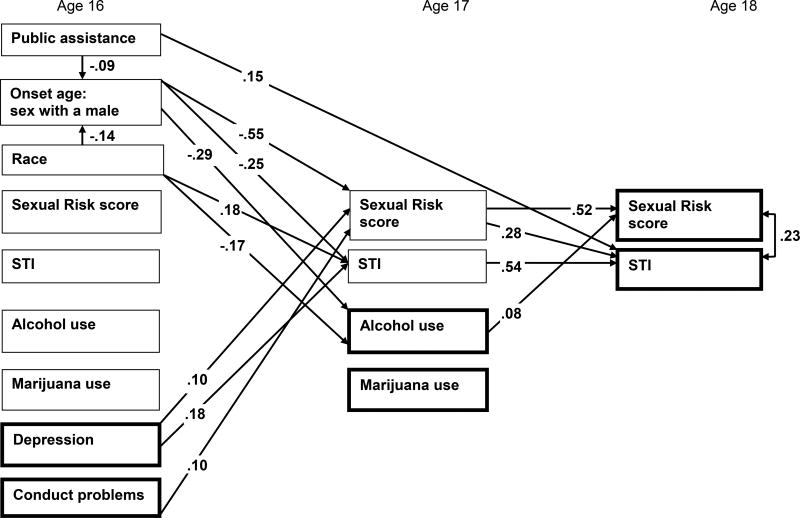
Figure 2.
Path model showing selected paths (p<.05) predicting sexually transmitted infection status and sexual risk score at age 18
Legend
Note: N=1750. Bolded boxes represent the variables in the conceptual model depicted in Figure 1. The main outcomes of interest are age 18 sexual risk score and STI status. To provide a stringent test of the conceptual model, covariates were added to the path model, such as race, age 16 public assistance, age of onset for sex with a male. The model also controlled for age 16 alcohol and marijuana use, and sexual risk behavior and STI status, when predicting age 17 alcohol and marijuana use, and sexual risk behavior and STI status. Only statistically significant paths of interest, as described in text are depicted (see supplementary materials for the path model with all statistically significant paths shown).
A weighted least squares means and variance adjusted (WLSMV) estimator was used. Standardized estimates and significant (p<.05) paths are shown. A direct effect of race on age of sexual onset was included, given racial differences in this variable and sexual onset was only included at one time point. Covariances between other baseline variables and between age 18 variables were modeled, but are not shown. Race coded 1=White, 2=Black. Public Assistance use is coded 0=no, 1=yes. STI= self-report of a past year diagnosis of sexually transmitted infection (chlamydia, gonorrhea, trichomoniasis), coded 0=no, 1=yes. Mediation was tested using the indirect command and 1000 bias corrected bootstrap samples.
R2 values for endogenous variables: age of sexual onset= 0.04, age 17 alcohol frequency= 0.36, age 17 marijuana frequency= 0.36, age 17 sexual risk score= 0.52, age 17 STI= 0.24, age 18 sexual risk behavior score= 0.38, age 18 STI= 0.58.

