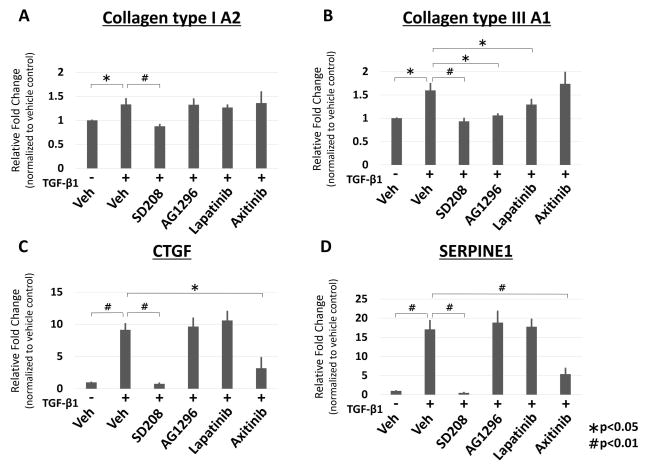
Figure 3.
Gene expression analysis using qRT-PCR of known CTS fibrosis marker genes Col1, 3, CTGF, SERPINE1 upon cytokine receptor level inhibition. CTS fibroblasts were treated with TGF-β1 and TβRI (SD208), PDGFR (AG1296), EGFR (Lapatinib) and VEGFR (Axitinib) inhibitor for 24 hours. Gene expression is normalized to vehicle control. All data are expressed as mean ± SE. n=5. (* indicates p < 0.05, # indicates p < 0.01).

