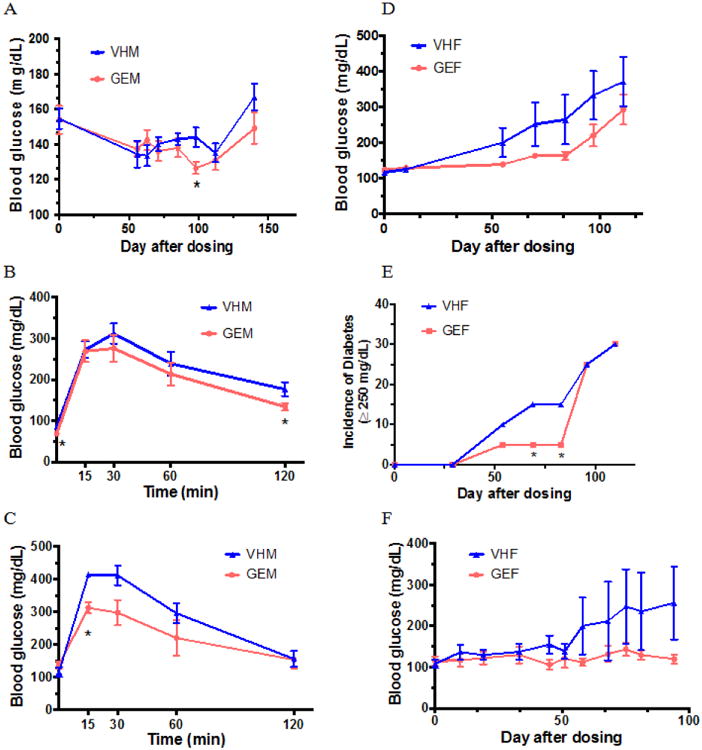
Figure 1.

Time course studies for the blood glucose levels and glucose tolerance test (GTT) in NOD mice. (A) Blood glucose levels (BGLs ± SE) in NOD males (N = 10/group) on PicoLab diet; (B) GTT for NOD males at day 128 after initial dosing on PicoLab diet (N = 10/group); (C) GTT for NOD males on 5K96 diet prior to euthanasia (N = 4/group); (D) BGL (± SE) in NOD females on PicoLab diet (N = 10/group); (E) The incidence of T1D in NOD females on PicoLab diet (N=10/group). A BGL ≥ 250 mg/dL was considered T1D. (F) BGL (± SE) in NOD females on 5K96 diet (N = 5/group). *, p < 0.05. VHM = NOD males dosed with vehicle (VH); VHF = NOD females dosed with VH; GEM = NOD males dosed with genistein (GEN); and GEF = NOD females dosed with GEN.
