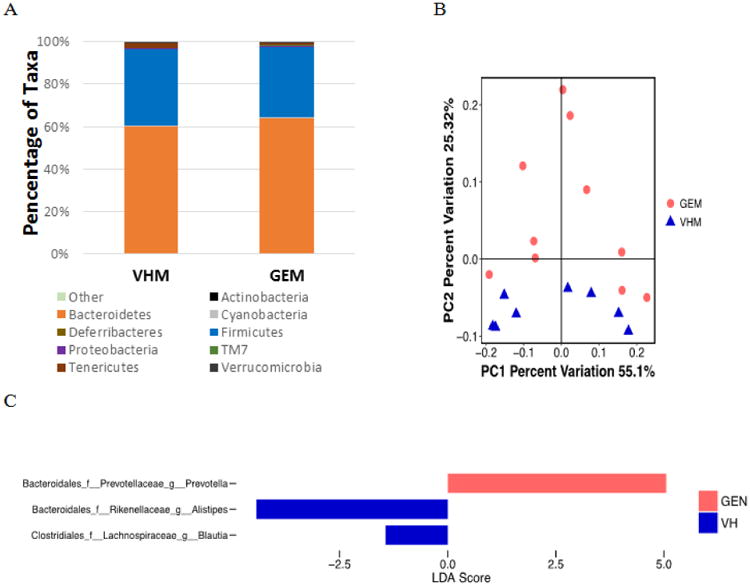
Figure 2.

The composition of gut microbiome based on 16S rRNA sequencing in NOD males on PicoLab diet treated with genistein (GEM, N = 10) or vehicle (VHM, N = 8). (A) The taxonomy of the gut microbiome at the phylum level when the individual animal data were combined for analysis according to the treatment. (B) The β-diversity based on the weighted Unifrac index. Each of the symbols (closed circles and triangles) represents one animal and is illustrated by Principal Coordinate Component (PCoA), and the primary principal component (PC1) and secondary principal component (PC2) are shown. Eigenvalues of PCoA represented by the distance matrix can be interpreted in terms of percentage of total variability (x-axis and y-axis). The distance between two symbols suggests dissimilarity between the two samples. Weighted Unifrac takes into account the differences in abundance of taxa between samples. (C) Linear Discriminant Analysis Effective Size (LEfse) results at the genus level between VHM and GEM groups. LEfse is used to elucidate the differences in bacterial taxa.
