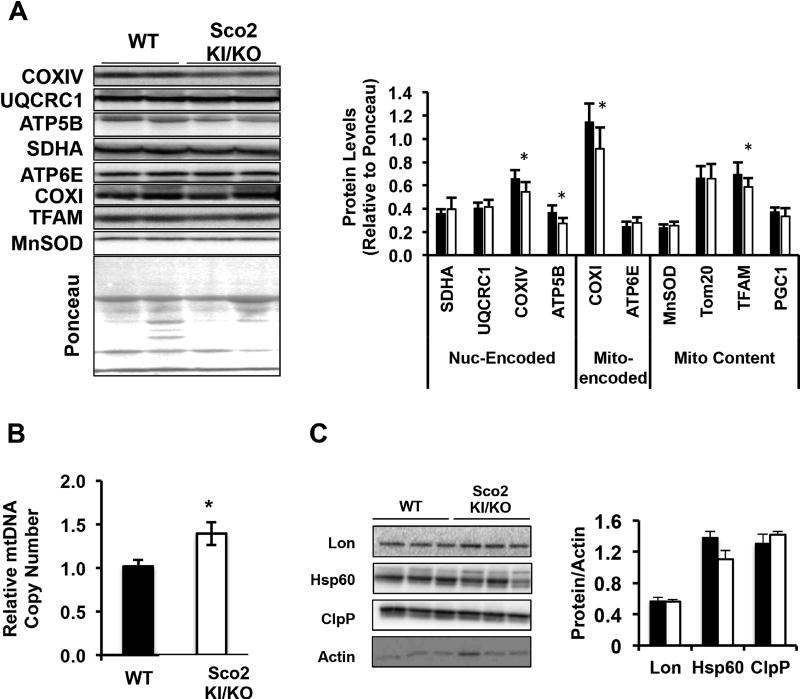
Figure 5. Mitochondrial DNA and ETC complexes are altered in Sco2 KI/KO eWAT.
A) Western blot analysis of mitochondrial resident proteins and ETC subunits. B) Quantitation of western blots in 5A relative to Ponceau. C) Relative mtDNA copy number in eWAT by quantitative real time PCR (*, p<0.05). D) Representative immuno blots of UPRMT components Lon, Hsp60 and ClpP in eWAT. β-actin was used as a loading control. E) Quantitation of immuno blots in 5D relative to Ponceau. For all analyses, the bars depict the mean ± SEM (WT, n=6; Sco2 KI/KO, n=6) and statistical significance was determined with the unpaired Student’s t-test. Dark bars denote wild-type mice and open bars represent Sco2 KI/KO mice.

