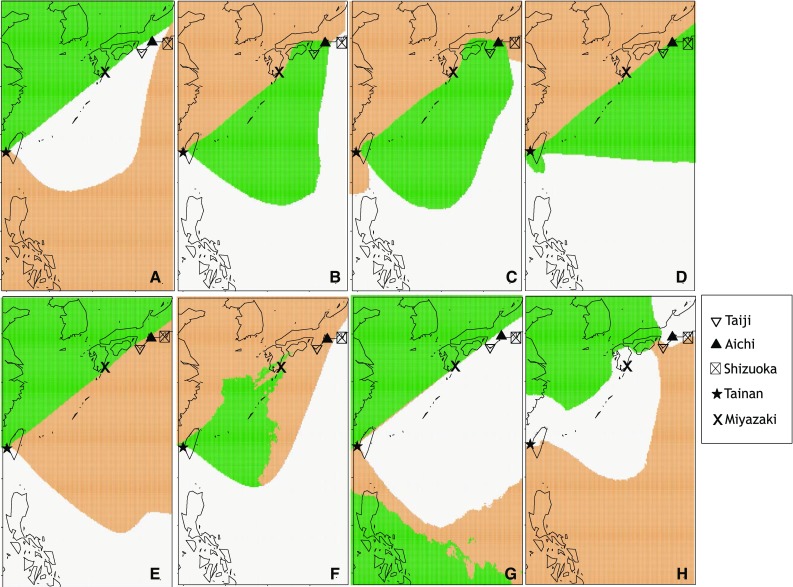
Fig. 3.

Eight variations of the individual population membership assignment patterns shown in the 10 runs with the highest LPP for K = 3 in Geneland analysis. The colours indicate the distribution of K clusters based on the mode of simulated posterior probability for each pixel. The landmarks mentioned in the text are shown
