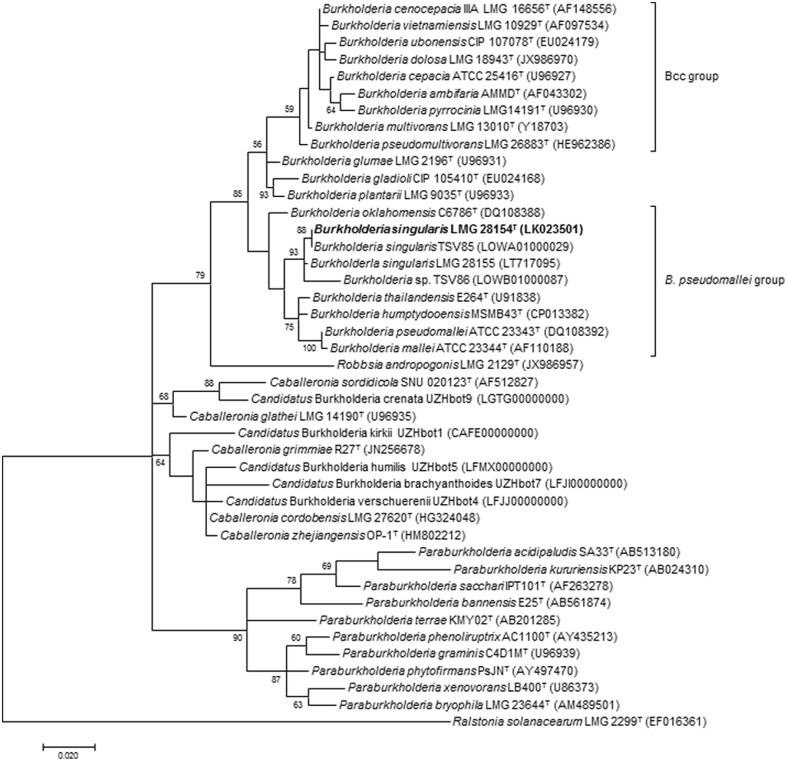
FIGURE 1.
Phylogenetic tree based on nearly complete 16S rRNA gene sequences of Burkholderia representatives and B. singularis sp. nov. isolates. The optimal tree (highest log likelihood) was constructed using the Maximum Likelihood method and Tamura-Nei model in MEGA7 (Kumar et al., 2016). A discrete Gamma distribution was used to model evolutionary rate differences among sites [5 categories (+G, parameter = 0.3465)] and allowed for some sites to be evolutionarily invariable ([+I], 42.1434% sites). The percentage of replicate trees in which the associated taxa clustered together in the bootstrap test (1000 replicates) are shown next to the branches if higher than 50%. The sequence of Ralstonia solanacearum LMG 2299T was used as outgroup. The scale bar indicates the number of substitutions per site. Taxonomic type strains are indicated by superscript T in strain numbers.

