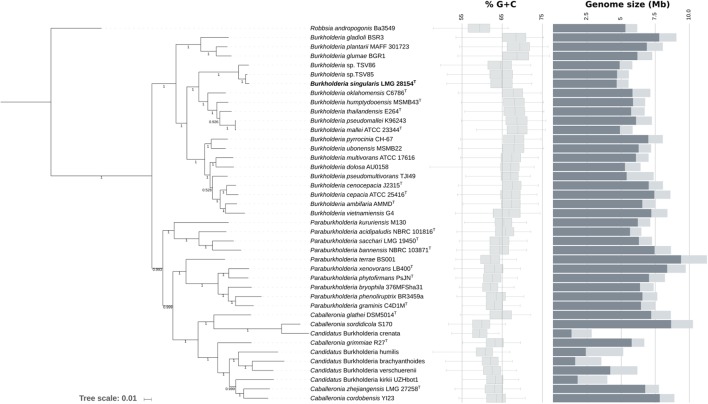
FIGURE 2.
Genomic phylogeny and characteristics of the genus Burkholderia. The phylogenetic tree was built using an alignment of 23 conserved single copy COGs and an approximate maximum-likelihood approach (see Materials and Methods for details). The %G+C distribution was calculated on non-overlapping 1 kb segments for each genome and plotted as box plots with extreme values removed for clarity. Total genome size (bar plot) is approximated by size of the assembly and coding content (dark gray) corresponds to the sum of the length of all annotated CDS features, discounting predicted pseudogenes. Shimodaira-Hasegawa-like local support values as given by the program Fasttree are indicated.

