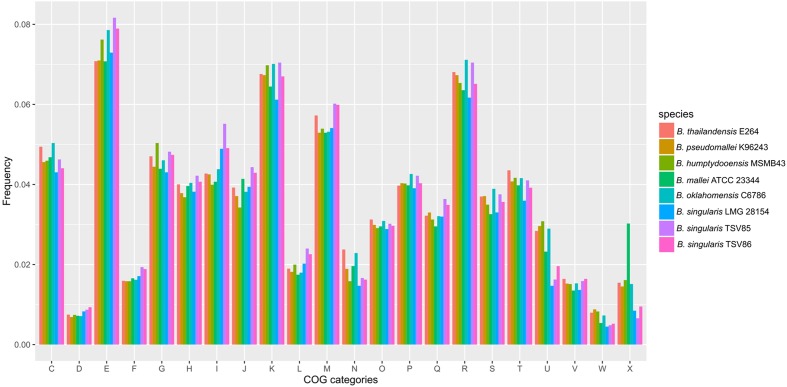
FIGURE 3.
Distribution of genes in COG functional categories. Frequencies of genes in COG categories of selected Burkholderia genomes. The values represent the number of genes in COG categories, divided by the total number of genes with a COG assignment (genes without COG assignments are not counted for clarity). (C) = Energy production and conversion, (D) = Cell cycle control, cell division, chromosome partitioning, (E) = Amino acid transport and metabolism, (F) = Nucleotide transport and metabolism, (G) = Carbohydrate transport and metabolism, (H) = Coenzyme transport and metabolism, (I) = Lipid transport and metabolism, (J) = Translation, ribosomal structure and biogenesis, (K) = Transcription, (L) = Replication, recombination and repair, (M) = Cell wall/membrane/envelope biogenesis, (N) = Cell motility, (O) = Posttranslational modification, protein turnover, chaperones, (P) = Inorganic ion transport and metabolism, (Q) = Secondary metabolites biosynthesis, transport and catabolism, (R) = General function prediction only, (S) = Function unknown, (T) = Signal transduction mechanisms, (U) = Intracellular trafficking, secretion, and vesicular transport, (V) = Defense mechanisms, (W) = Extracellular structures, (X) = mobilome.

