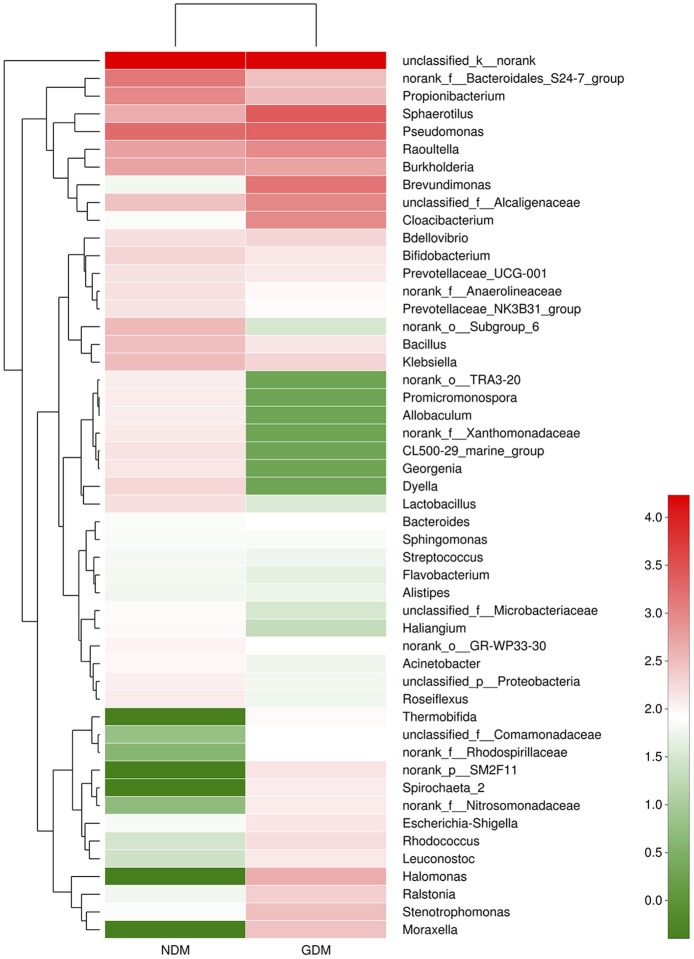
Figure 2.
Heatmap analyses of placental microbiota at the genus level. The y axis is a neighbor-joining phylogenetic tree, each row is a different phylotype. The color of the spots in the right panel represents the mean relative abundance of the genera in each group. n = 10, in each group. GDM, gestational diabetes mellitus; NDM, Non-GDM.

