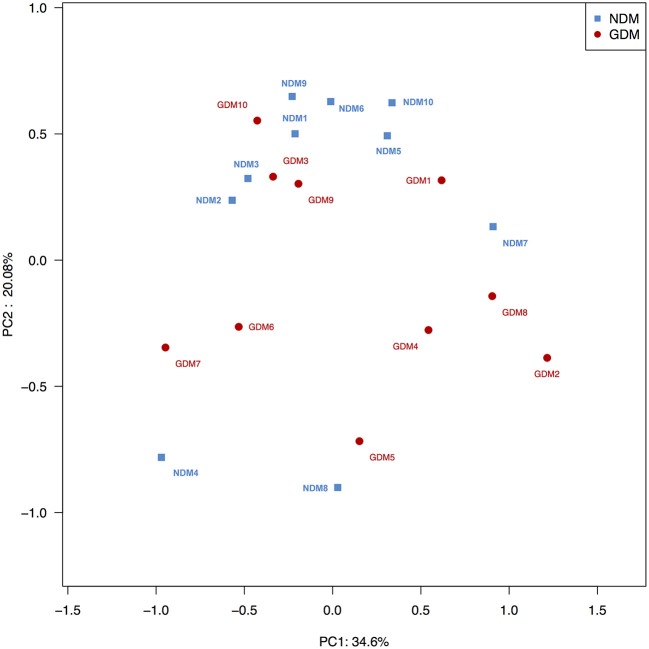
Figure 3.
Principal coordinate analysis plots in placental microbiota. Weighted UniFrac PCoA plot based on OTU abundance. Each point represents the placenta microbiota of a newborn, with macrosomia group (red triangle) and control group (green circle). n = 10 in each group. GDM, gestational diabetes mellitus; NDM, Non-GDM.

