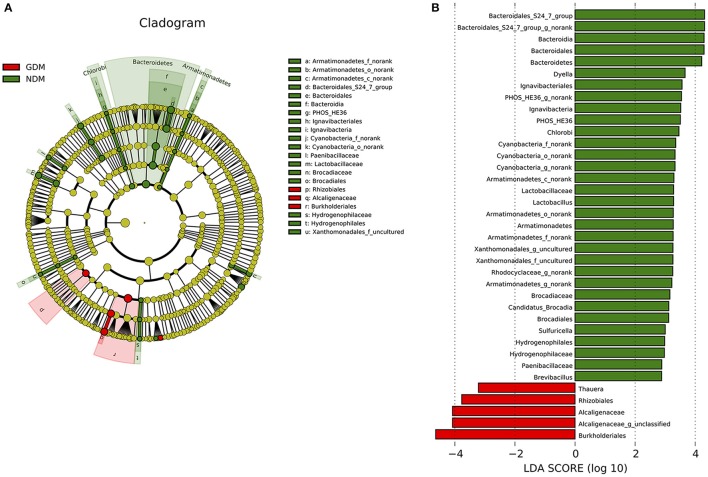
Figure 4.
Different structures of placental microbiota between GDM and NDM groups. (A) Cladogram representation of different placental microbiota taxa, from the phylum level down to the bacteria level. Red indicates taxa enriched in GDM case subjects, and green indicates taxa enriched in control subjects. The diameter of each circle is proportional to the taxon's abundance. (B) Histogram of the LDA scores for differentially abundant taxa (red: GDM; green: NDM). LDA scores were calculated by LDA effect size, using the linear discriminant analysis. n = 10, in each group. LDA, linear discriminant analysis; GDM, gestational diabetes mellitus; NDM, Non-GDM.

