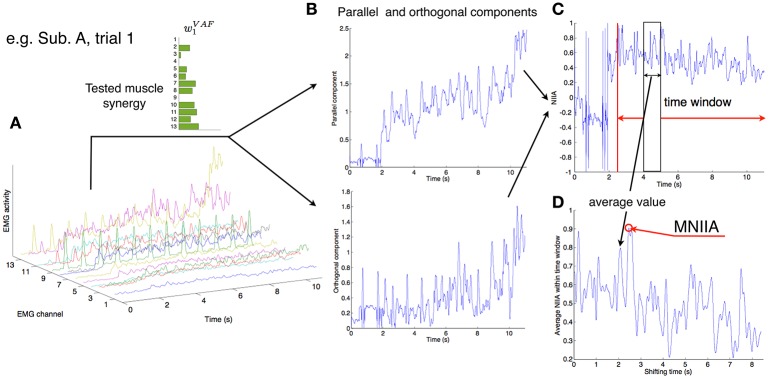
Figure 2.
Calculation of MNIIA criterion. (A) The 13 EMG activity patterns of Subject A in trial 1. In trial 1, the tested muscle synergy vector was w1VAF. (B) The 13 EMG activities were transformed into the parallel and orthogonal components in real time (Figure 1A). The difference between the parallel and orthogonal components is the IIA criterion. The value of IIA is shown to the subjects in real time (Figure 1E). (C) In off-line analysis, the IIA is normalized (NIIA) and averaged within the time window. (D) The averaged NIIA within the time window is calculated at all time points during analysis duration (from 2.5 to 11 s after task onset). We determined a maximum NIIA (MNIIA) in each trial.

