
Figure 1.
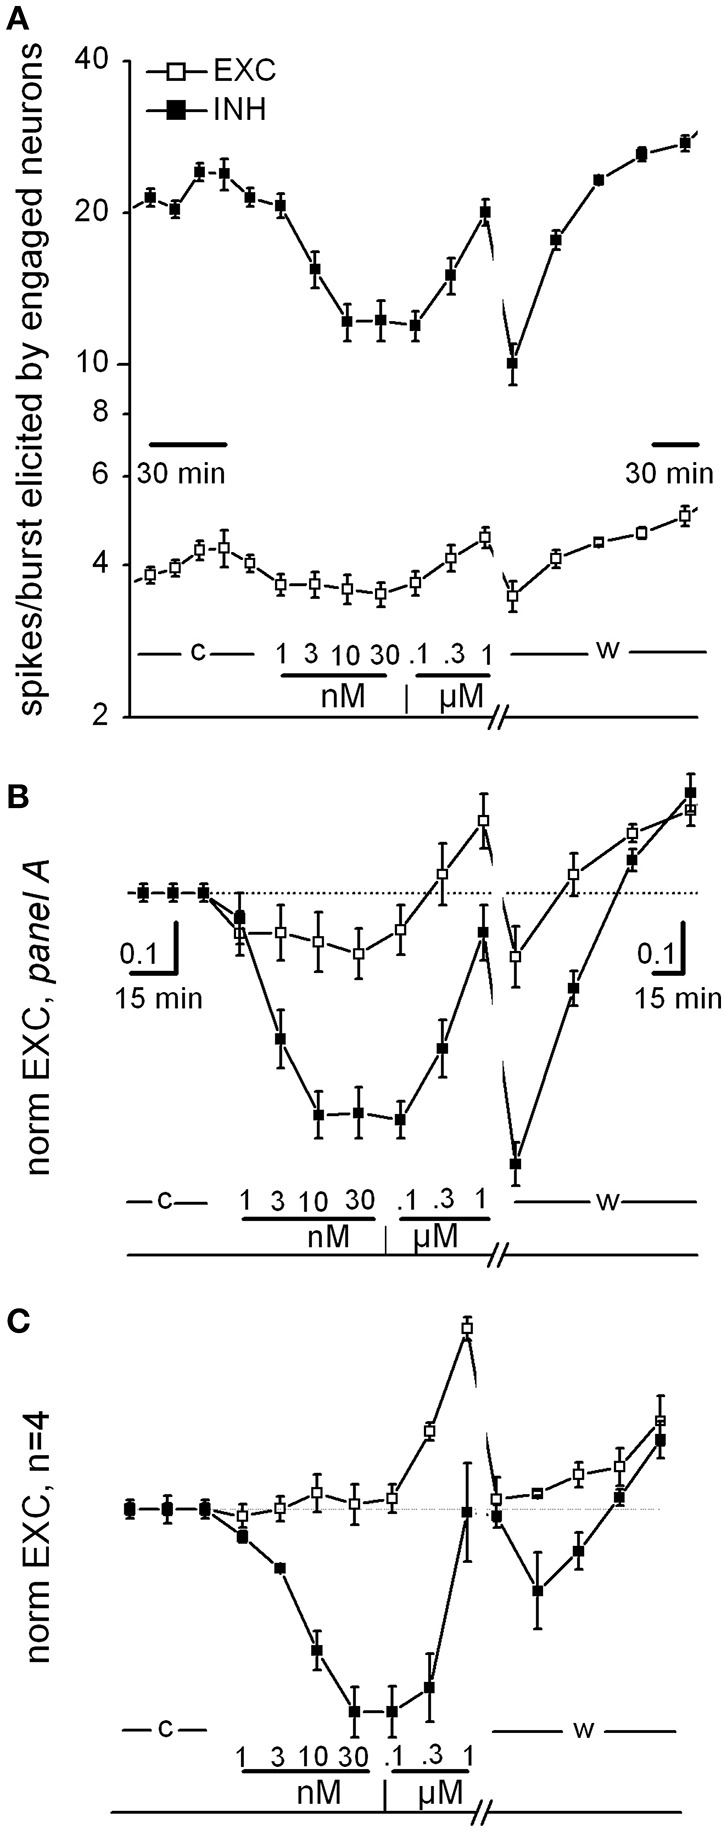
Curcumin dose-response relationship. (A) Time plot of excitability (EXC) for inhibitory and excitatory neurons (closed and open symbols, respectively) recorded in one exemplary dish. Data before and after the washout time break (13 min) have different time resolution (see calibration bars). The time course of curcumin (CU) application is described above the bottom line as follows: c, w, control and washout; numbers are [CU] in nM and μM as indicated. (B) Same data as in (A), but values were normalized to those of control and superimposed in order to be compared. Note that in this experiment, CU either decreased the excitability of both inhibitory and excitatory cells in the 1–30 nM concentration region or increased excitability in the further 30–1,000 nM concentration region, in a reversible manner. (C) Plot as in (B), but average of data from four independent experiments from different dishes but similar DIVs.