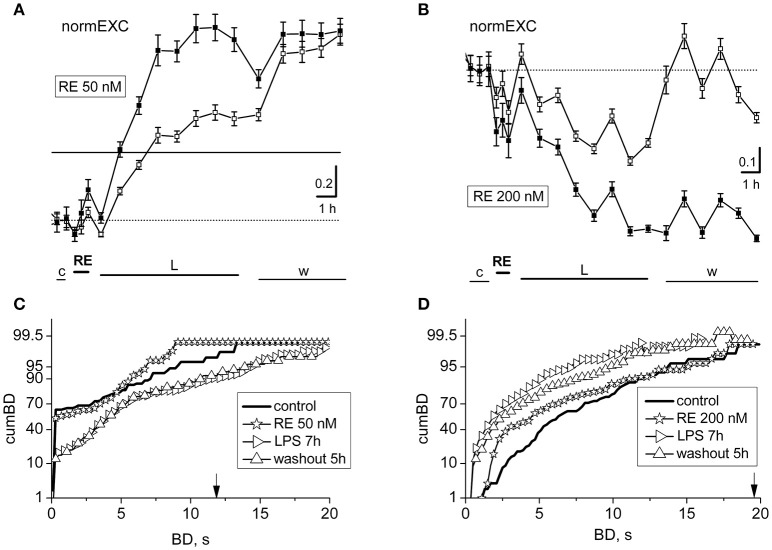
Figure 4.
Effects of resveratrol (50 or 200 nM) on LPS responses. Data in (A,B) and (C,D) derive from two experiments performed on a single dish at 14 or 20 DIV. (A,B) Plots of normalized excitability following application of resveratrol (RE) 50 nM (A) or 200 nM (B) and LPS (3 μg/ml). The continuous line is the fixed threshold. Note that in (A), the late excitatory responses to LPS were not prevented, whereas in (B) the responses were inhibited. (C,D) Plots of cumBD in the same conditions as in (A,B). The vertical arrow indicates the fixed threshold.

