
Figure 7.
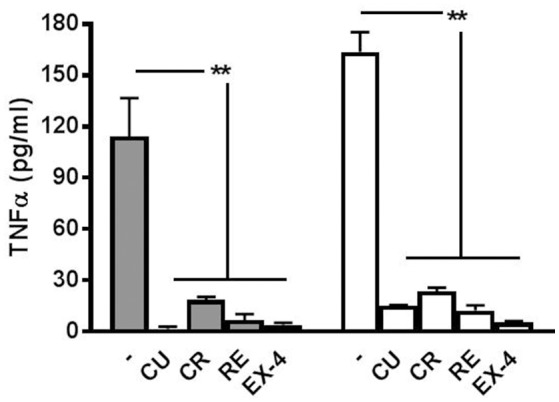
Release of TNF-α at 6 and 12 h after LPS application. The cytokine TNF-α is released from LPS-treated networks but not from networks pre-treated with polyphenols or exendin-4. Graph shows TNF-α concentration 6 h (filled bars) and 12 h (open bars) post-LPS (3 μg/ml) treatment with or without curcumin (CU, 1 μM) crocin (CR, 20 μM), resveratrol (RE, 200 nM) or exendin-4 (EX-4, 30 nM) pre-conditioning. Data are expressed as pg/ml and represent mean ± SEM of three independent experiments. **P < 0.01 (ANOVA, Dunnet's test).