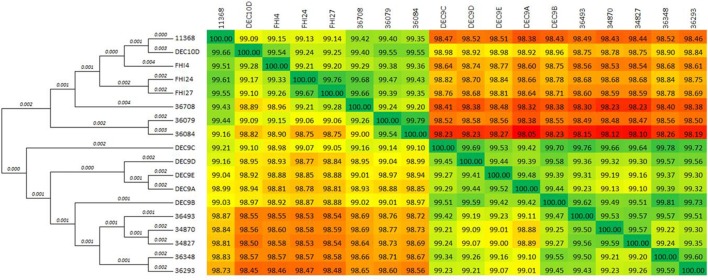
Figure 1.
Phylogenetic overview of the O26:H11 isolates. The whole genomes of the 18 isolates were compared using Gegenees 2.1 and Mega 6.06. The heat-plot comparison matrix is based on a fragmented alignment using BLASTN (200/100) with a threshold set at 30%. The percentage similarities between the conserved regions of the genomes are indicated in the comparison matrix, where the colors vary from red (low similarity) to green (high similarity). The distance matrix was used to produce a dendrogram in Mega using the neighbor-joining method. The optimal tree with the sum of branch length = 0.05552887 is displayed (branch lengths are shown above the branches).

