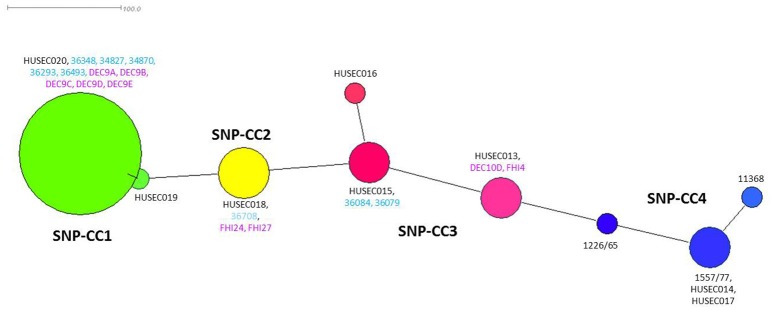
Figure 2.
Minimum spanning tree based on 48 SNPs (Bletz et al., 2013). Each node represents a unique SNP profile. The node size is proportional to the number of isolates. The four clonal complexes (SNP-CCs) are represented by different colors: SNP-CC1 is shown in green, SNP-CC2 in yellow, SNP-CC3 in red and SNP-CC4 in blue. This figure was created with Splitstree (version 4.12.6). Representative strains for each SNP-CC and sequenced by Bletz et al. (2013) are indicated in black, French strains sequenced in this study are indicated in light blue and strains extracted from published WGS projects are indicated in purple.

