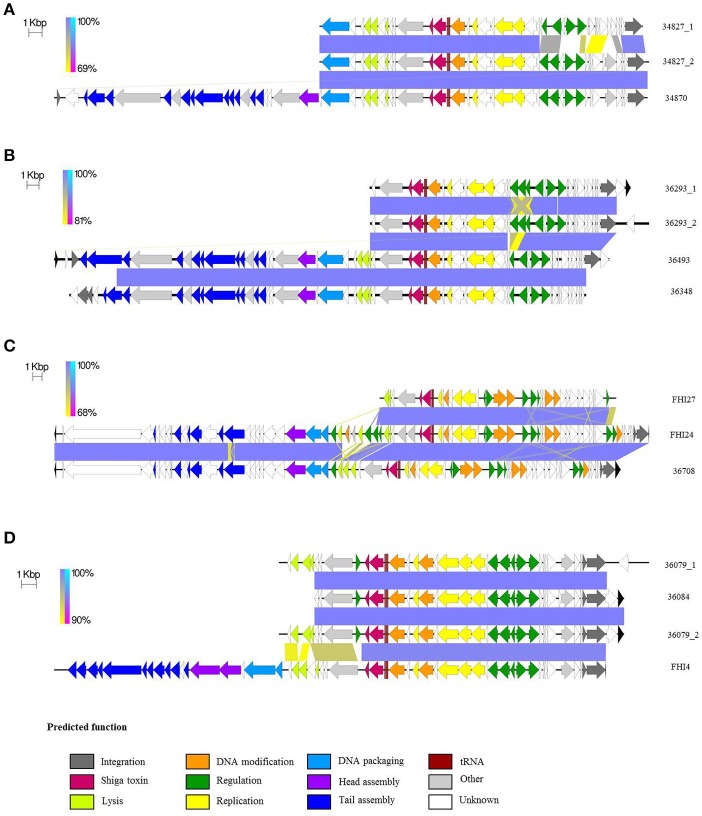
Figure 5.
Comparative analysis of the various stx-prophages in the O26:H11/H- strains. (A) Comparison of SNP-CC1 Stx2a. (B) Comparison of SNP-CC1 Stx2d prophages. (C) Comparison of SNP-CC2 Stx2a prophages. (D) Comparison of SNP-CC3 Stx2a prophages. The sequences of the stx-prophages were compared with EasyFig. The homologous regions are connected. The color of the zone connecting the strains is related to the direct or reverse homology between the strains according to the scale present at the left of each comparison. The arrows depict ORFs identified with PROKKA. The direction of the arrow represents the transcription orientation. The ORFs are color-coded according to their predicted function. Black arrows indicate ORFs outside of the predicted prophages.

