
FIGURE 3.
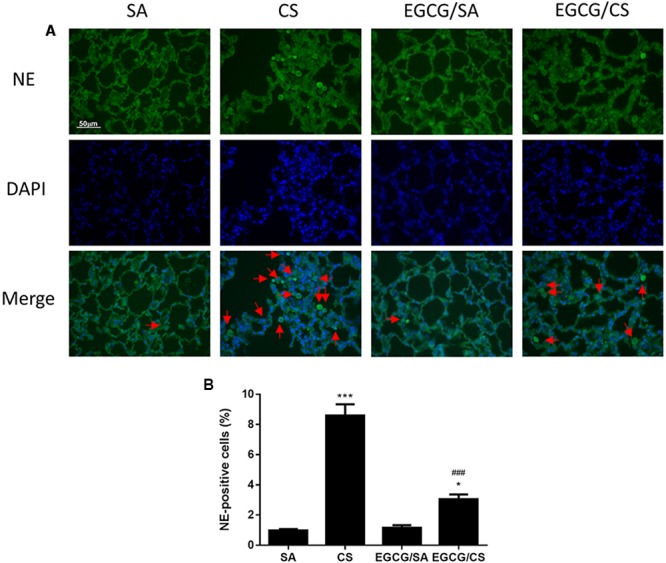
Effect of EGCG on neutrophil infiltration in rat lung. Rats treated with EGCG or control vehicle were killed on day 57 and the left lung was formalin-fixed and sectioned for immunofluorescence (magnification ×400). (A) Representative immunofluorescence images of tissue neutrophils as neutrophil elastase (NE)-positive cells with green fluorescence in lung sections. Nuclei were stained with DAPI in blue fluorescence. Scale bar, 50 μm. Arrows indicate representative cells with positive staining. (B) Quantification of NE-positive cells in the lung sections. The results are expressed as means ± SEM; n = 6 each group. SA group, water/sham air; CS group, water/cigarette smoke; EGCG/SA group, EGCG (50 mg/kg)/sham air; EGCG/CS, EGCG (50 mg/kg)/cigarette smoke. ∗p < 0.05 and ∗∗∗p < 0.001 for the comparison to SA group, ###p < 0.001 for the comparison between EGCG/CS and CS group.