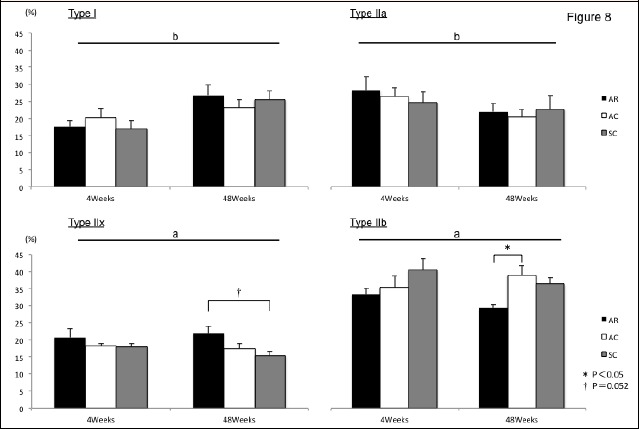
Figure 8.

Relative distribution of muscle fiber type in semimembranosus muscle. Abbreviations are the same as in Figure 3. Unit: %. Values are means ± SEM. n=5 in each group. a: a significant main effect of treatment; b: a significant main effect of time; *: p<0.05.; †: p=0.052.
